Utilizando “Hive Bee Balanced” para obtener datos de jugadores en Splinterlands [ES-EN]
Cover created in Canva

Esta herramienta fue creada con distintos fines, aunque principalmente es utilizada para mostrar el KE Ratio de los distintos usuarios que hacen vida en “Hive” y es excelente para conocer el estatus que tienen los jugadores que están activos en “Splinterlands”, por lo que, si o si, conocer y utilizar esta herramienta es imprescindible y estoy seguro de que se volverá con el tiempo aún más relevante, por lo que, en este post pretendo justamente eso, enseñarles de manera muy básica cómo funciona.
Ahora bien, digo enseñarles de manera muy básica porque aún estoy aprendiendo y explorando todas las posibilidades que puede brindarnos esta herramienta, sin embargo, para los que aún no lo han visto ni la primera vez, estoy seguro de que les será de mucha utilidad, en especial para aquellos amantes de los datos, sean del lado de “Hive” o les guste también conocer algo sobre “Splinterlands” y utilizarlo para crear contenido, así que, es muy interesante saberlo.
Entonces, si no has escuchado sobre “Hive Bee Balanced”, quédate hasta el final de esta publicación, será información de mucho valor, ya que es una herramienta que aún está en desarrollo, pero que, con la información que ofrece de momento, es bastante genial:

¿Cuáles son las opciones básicas en “Hive Bee Balanced”?

Las opciones de la plataforma son básicas, pero, bastante poderosas, así que, para comenzar, les detallare algunos aspectos geniales de esta plataforma:
Bee Balanced: Esta es la primera opción que nos encontramos en la plataforma, básicamente funciona para ver los datos principales de cualquier usuario en “Hive”, ademas de sus estadísticas en “Splinterlands”, me refiero a que activos posee en el juego y su cantidad, algo muy importante especialmente para los curadores de “Splinterlands” como yo. Por otro lado, y muy importante, podemos ver el KE Ratio de los jugadores.
Comments List: En esta opción, podremos ver los comentaristas de un determinado post y aunque no parezca muy útil a primera vista, sí que lo es, principalmente tienes los nombres de los usuarios que te comentan y puedes copiarlos de forma inmediata, para dirigirte a “Bee Balanced”, para obtener los datos de todos esos usuarios de forma rápida y sencilla, por lo que, es bastante útil.
Top Holders: Ya en esta opción podemos obtener mucha más información de utilidad referente a los jugadores que tienen más “HP y/o SPS”, lo que puede brindarnos mucha información con respecto a los inversores y jugadores que tienen una mayor apuesta en el ecosistema. Por supuesto, si no sales en esta tabla no te preocupes, considero que tengo buena inversión en el juego, pero aun así no llego al “Top 100”, pero agrego valor de deferentes maneras.
Custom Queries: Esta es una de las opciones más potentes de la herramienta y donde podremos obtener información muy completa configurando los filtros y conocer que activos, poseen algunos usuarios con respecto a “Hive y Splinterlands”, esta es una opción aun en desarrollo, por lo que es normal encontrarse con algunos errores en el camino, pero, las posibilidades de obtener información bastante esclarecedora e informativa es bastante alta.
Ahora bien, la forma de obtener datos básicamente las he comentado brevemente en las opciones anteriores, pero, en la siguiente sección explorare un poco más, recordando que, también estoy experimentado todo lo que tiene para ofrecer, especialmente en las 2 ultimas opciones en donde podremos configurar y/o filtrar ciertos datos de acuerdo con las opciones que la misma herramienta nos ofrece, pero, como mi intención no es aburrirlos, veamos los datos de “Top Holders”.
¿Como obtener datos en “Top Holders”?

En esta sección veremos la información más relevante del post, ya que tratare de mostrarles como realizar consultas en las últimas 2 opciones, las cuales, son un poco más configurables que el resto, en todo caso, no se preocupen si no entienden del todo, con la práctica sabrán que hacer y cómo usarla, así que, sin más, comencemos:

¿Cómo usar Top Holders?
En primera instancia nos encontramos con 2 opciones que son:
- Top 100 HO Holders with posting rewards ﹥500
- Richlist Staked SPS Holders
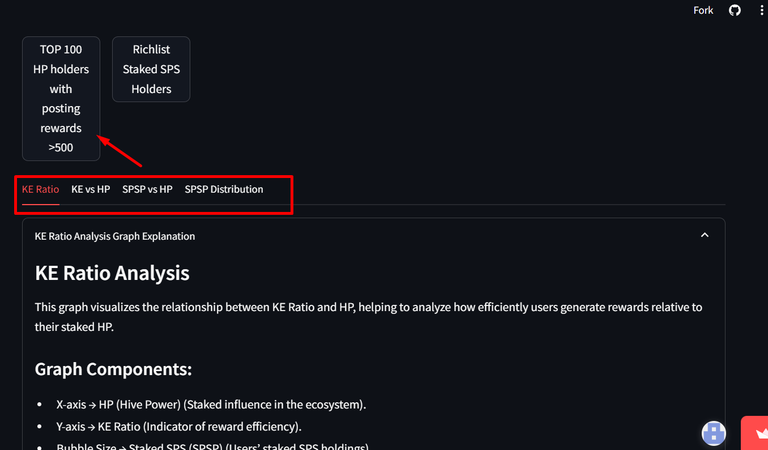
Ahora bien, al dar clic en el primero, podemos observar que la herramienta inicia la recopilación de todos los datos, consultando a las API involucradas para obtener la información que requerimos; y una vez lo hace, podemos ver 4 opciones diferentes que nos arrojaran distinta información según lo que queramos ver, ademas, justo debajo de estas opciones que funcionan como una especie de filtro, podemos ver una explicación de como analizar el grafico que esta debajo, recomiendo leerlo para entender más el proceso:
Lo interesante de esto, es que cuando seleccionamos cualquiera de las 4 opciones, la explicación justo debajo cambia, así que dependiendo de lo que quieras observar, debes leerlo para entender la información que nos refleja, por ejemplo, en la siguiente imagen que nos da un gráfico, lo explicare mejor:
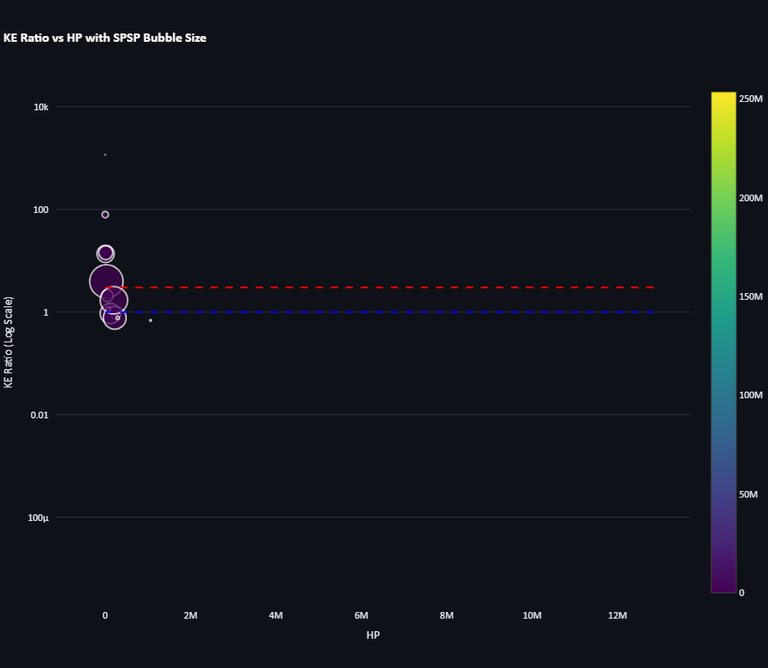
En ese grafico podemos ver que, el eje Y nos muestra el KE Ratio y de la X el HP que poseen los usuarios, los usuarios son las “Burbujas” que observamos en la imagen, ahora bien, mientras estas burbujas se encuentren más arriba, mayor será su KE Ratio, lo que significa que, estos usuarios reciban mayores recompensas en relación con su HP, lo que es genial saberlo, pero estas no son todas las posibilidades, ya que, si tienen un KE alto y un HP bajo, probablemente generan más con su HP en Stake.
Ahora, mientras más grande será la burbuja, significa que tienen más SPS en Staking, y si adicional a esto, tienen un KE bajo, la eficiencia de las recompensas que generan en comparación con los demás, es mucho mejor, por lo que, lo ideal es tener ese equilibrio entre un KE medianamente bajo y un HP acorde para que tu KE al menos sea inferior a 3 puntos.
Comparación SPSP y HP
Esta es una de las opciones más interesantes para explorar, ya que podremos ver la distribución del SPSP, que no es más que el SPS que se encuentra en Staking por parte de los usuarios y su HP, básicamente su participación y/o inversión en el ecosistema de “Hive”. Lo interesante de este grafico es como lo leemos, igualmente, tienes la explicación de lo que puedes observar en el grafico justo debajo, pero, veamos esta imagen para llegar a algunas conclusiones:
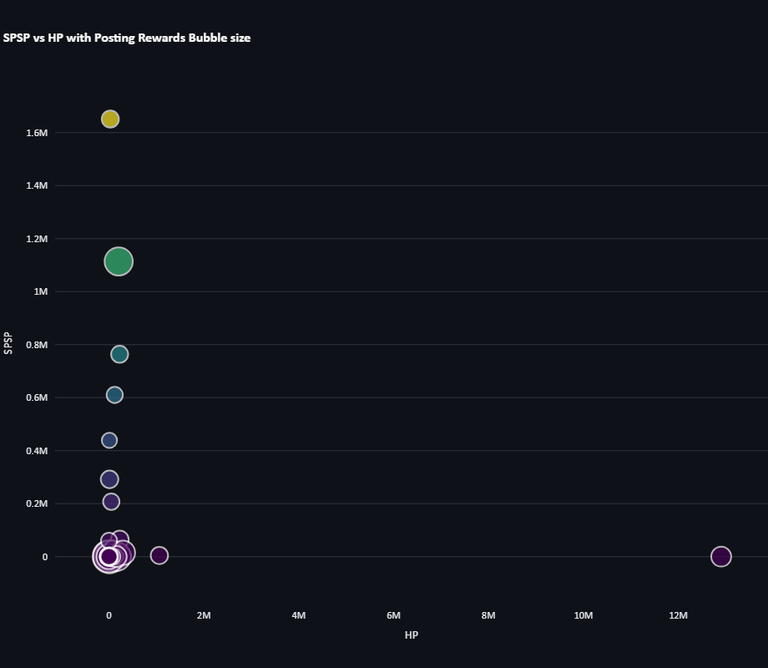
En la imagen anterior podemos ver un gráfico similar al anterior, pero, este nos refleja diferentes datos, por ejemplo, los usuarios que tienen una “Burbuja” más grande, son los que han ganado mayores recompensas por publicaciones y mientras más alto este el punto en el gráfico, mayor SPS en Staking posee, ademas, mientras más a la derecha este el punto, que si podemos ver hay un solo punto bastante alejado del resto, significa que tiene mayor HP.
Consideraciones Finales
Si bien he mostrado de manera básica las posibilidades que tiene esta valiosa herramienta, sin duda les dejare el enlace para que ustedes mismos puedan experimentar y evaluar todos los datos, la verdad es que es bastante poderosa y con tan solo algunos clics podremos ver, analizar y/o evaluar muchos aspectos del ecosistema de “Hive y Splinterlands”, sea de manera individual o en su defecto de manera combinada.
En otra publicación dejare explicación de cómo funciona la última opción que es más configurable que la explicada en este post, por lo pronto, para que puedan usarla, ingresen al siguiente enlace que dejare a continuación:
Nos vemos en el "Campo de Batalla"

This tool was created for different purposes, although it is mainly used to show the KE Ratio of the different users that make life in "Hive" and it is excellent to know the status of the players that are active in "Splinterlands", so, if or if, knowing and using this tool is essential and I am sure it will become even more relevant over time, so, in this post I intend just that, to teach you in a very basic way how it works.
Now, I say teach you in a very basic way because I am still learning and exploring all the possibilities that this tool can give us, however, for those who have not yet seen it even the first time, I'm sure it will be very useful, especially for those data lovers, whether they are on the side of "Hive" or also like to know something about "Splinterlands" and use it to create content, so, it is very interesting to know.
So, if you haven't heard about "Hive Bee Balanced", stay until the end of this post, it will be very valuable information, as it is a tool that is still under development, but with the information it offers at the moment, it is pretty cool:
What are the basic options in "Hive Bee Balanced"?
The platform options are basic, but, quite powerful, so, to begin with, I will detail some great aspects of this platform:
Bee Balanced: This is the first option that we find in the platform, basically it works to see the main data of any user in "Hive", in addition to their statistics in "Splinterlands", I mean what assets they have in the game and their quantity, something very important especially for the curators of "Splinterlands" like me. On the other hand, and very important, we can see the KE Ratio of the players.
Comments List: In this option, we will be able to see the commentators of a determined post and although it does not seem very useful at first sight, yes that it is, mainly you have the names of the users that comment you and you can copy them of immediate form, to go to "Bee Balanced", to obtain the data of all those users of fast and simple form, reason why, it is quite useful.
Top Holders: Already in this option we can get much more useful information regarding the players who have more "HP and/or SPS", which can give us a lot of information regarding investors and players who have a higher stake in the ecosystem. Of course, if you do not appear in this table do not worry, I consider that I have good investment in the game, but still I do not reach the "Top 100", but I add value in different ways.
Custom Queries: This is one of the most powerful options of the tool and where we will be able to obtain very complete information by configuring the filters and knowing what assets some users have with respect to "Hive and Splinterlands", this is an option still under development, so it is normal to encounter some errors along the way, but the chances of obtaining very enlightening and informative information is quite high.
Now, the way to obtain data basically I have commented them briefly in the previous options, but, in the following section I will explore a little more, remembering that, I am also experienced all that it has to offer, especially in the last 2 options where we can configure and/or filter certain data according to the options that the same tool offers us, but, as my intention is not to bore you, let's see the data of "Top Holders".
How to obtain data in "Top Holders"?
In this section we will see the most relevant information of the post, since I will try to show you how to make queries in the last 2 options, which are a little more configurable than the rest, in any case, do not worry if you do not fully understand, with practice you will know what to do and how to use it, so, without further ado, let's start:
How to use Top Holders?
In the first instance we have 2 options, which are:
- Top 100 HO Holders with posting rewards ﹥500
- Richlist Staked SPS Holders
Now, by clicking on the first one, we can see that the tool starts collecting all the data, consulting the APIs involved to obtain the information we require; and once it does, we can see 4 different options that will give us different information depending on what we want to see, also, just below these options that work as a kind of filter, we can see an explanation of how to analyze the graph below, I recommend reading it to understand more about the process:
The interesting thing about this, is that when we select any of the 4 options, the explanation just below changes, so depending on what you want to observe, you must read it to understand the information that reflects us, for example, in the following image that gives us a graph, I will explain it better:
In this graph we can see that the Y axis shows the KE Ratio and the X the HP that the users have, the users are the "Bubbles" that we see in the image, now, the higher these bubbles are, the higher their KE Ratio, which means that these users receive higher rewards in relation to their HP, which is great to know, but these are not all the possibilities, because if they have a high KE and a low HP, they probably generate more with their HP in Stake.
Now, the bigger the bubble, the more SPS they have in Staking, and if in addition to this, they have a low KE, the efficiency of the rewards they generate in comparison with the others is much better, so, the ideal is to have that balance between a medium low KE and an HP according to your KE at least below 3 points.
SPSP and HP Comparison
This is one of the most interesting options to explore, since we will be able to see the distribution of the SPSP, which is nothing more than the SPS that is in Staking by the users and their HP, basically their participation and/or investment in the "Hive" ecosystem. The interesting thing about this graph is how we read it, likewise, you have the explanation of what you can see in the graph just below, but, let's see this image to reach some conclusions:
In the previous image we can see a graph similar to the previous one, but, this one reflects different data, for example, the users that have a bigger "Bubble", are the ones that have earned higher rewards for publications and the higher the point in the graph, the higher SPS in Staking it has, also, the more to the right is the point, that if we can see there is a single point far away from the rest, it means that it has higher HP.
Final Considerations
Although I have shown in a basic way the possibilities that this valuable tool has, I will certainly leave the link so that you can experiment and evaluate all the data, the truth is that it is quite powerful and with just a few clicks we can see, analyze and / or evaluate many aspects of the ecosystem of "Hive and Splinterlands", either individually or in combination.
In another post I will explain how the last option works, which is more configurable than the one explained in this post, for now, so that you can use it, enter the following link that I will leave below:
See you at the "Battlefield".

Here is the direct link to my latest posts and the link to my Profile
Visit my website


If you are new, I invite you to register in this LINK

Proud Member of "Shield of Glory".

Posted Using INLEO
As a Hiver how much are you getting involved in Hive Governance Decisions? Your Hive power matters !! So use your Hive power wisely, Support the Return Proposal
Thanks for sharing! - @isaria
