Current Hive Chart (December 2022)
Hello again. I shared a Hive chart in the first days of last November. The price was at the level of $0.36. It is moving towards the supply-demand region, which is in the 0.35-0.29 price range. Today I will share the last Hive graphic of the year. There is a downward movement. Of course, it is not possible for us to know how far the price will fall or where it will turn and start to rise. Let me share the chart I followed.
I took the screenshots below from Tradingview site. I am following the HIVE/USDT chart of Binance exchange as the volume is higher. The first chart is weekly.
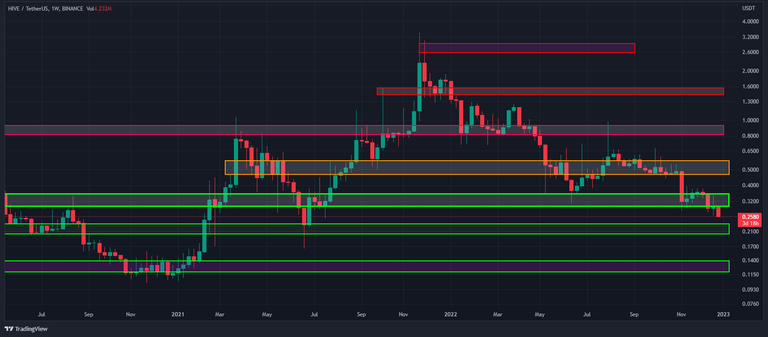
The above-mentioned 0.35-0.29 supply-demand region has been broken to the downside. The price is at the 0.25 level. 0.25, 0.2 etc. numbers are psychological resistances. Below is a supply-demand zone in the 0.23-0.2 price range. If there is an upward turn, we will test the 0.29-0.35 region again.
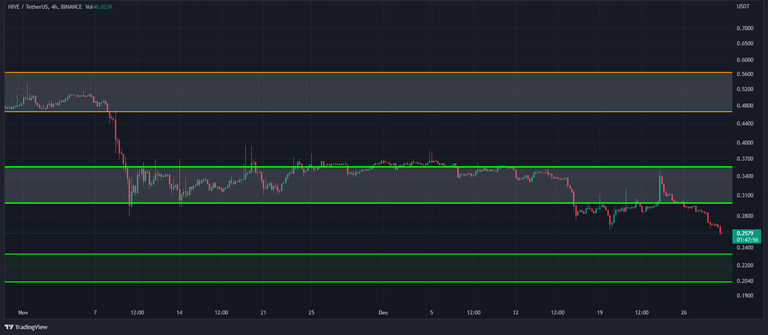
The chart above is for 4 hours. I added it for those who follow the price in the short term. The $0.25 and $0.2 prices are critical support points for us. If there is an upward price reversal, we will follow the $0.3 price.
This is not a bullish or bearish signal. And this article is not investment advice. You should make your investment decisions yourself according to your psychological and financial situation. It would be more beneficial to see this sharing as an educational work. Ll see.
If I have to be honest I won't mind Hive dropping to the 0.2 levels... And stay there for a montth or two.. But hey these things rarely happen as we want them too😂 gotta make for profits when the door is open... And when it closes it closes ey...
But if it may, I might be able to stack on some hive
Thanks, I have a feeling we could test $0,2 soon..
Post voted 100% for the hiro.guita project. Keep up the good work.
Stabilizer for CENT Token
New manual curation account for Leofinance and Cent
Yay! 🤗
Your content has been boosted with Ecency Points, by @anadolu.
Use Ecency daily to boost your growth on platform!
Support Ecency
Vote for new Proposal
Delegate HP and earn more
Nice one @anadolu. I have been thinking of the falling in price of hive, maybe it will hit the $0.1 before rising. My own view though.