
Bitcoin price 061026

(edited)
The 3 month chart is looking a little Spooky, what do you think?

https://bitcointicker.co/stamp/btc/usd/3Mth/
Six month chart, what does this look like?

https://bitcointicker.co/stamp/btc/usd/6Mth/
Can we recognize any of these? Triple bottom, or inverse head and shoulders?

Cup and handle? Rectangle? The 24hrs, is that a Broadening Triangle or Head and Shoulders?

https://bitcointicker.co/stamp/btc/usd/24hr/
BTC Market Cap Dominance is 58.8%, up from 58.3% 16 days ago.

1 Month Candles: $85,492 USD
Up from $81,208 USD 16 days ago.

https://www.tradingview.com/symbols/BTCUSD/
How low can BTC go in 2026?

https://www.coingecko.com/en/coins/bitcoin

$100 USD = 0.0011,7208 BTC
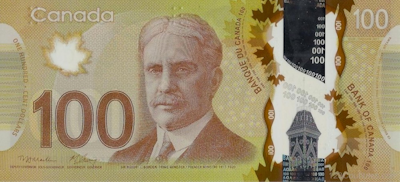
0.0008,2300 BTC = $100 CAD
Will you buy more BTC in October 2026?
This is not financial advice, just observations over time.
Do your own research!


0.07447173 BEE
Then there is the !PIZZA chart pattern, always with mozza cheese.
!PIZZA !
honestly trying to make sense of all those chart patterns always gives me a headache after a while
Always a good time to buy and hodl!
$PIZZA slices delivered:
@darkflame(1/15) tipped @kerrislravenhill
kerrislravenhill tipped darkflame
Learn more at https://hive.pizza.