5 Hive Engine Tokens Making Technical Analysis Moves for 3/14/2022
It is 3/14/2022 and here are the Hive Engine Tokens making waves from Technical Analysis Perspective.
Traders of different trading philosophies would agree that it is important to gain an understanding of a Hive Engine Token's price action. This importance varies among traders, but it still remains important as traders look to buy low and sell high. Every trading day (which is every day in Hive Engine Market) presents new opportunities to examine Hive Engine Tokens and their price movement (technical analysis).
Let’s examine the tokens that have made the most recent technical analysis moves with various indicators. This is a selection of tokens that have made the most significant movements that can have an impact in the short and long term. None of the below is financial advice, you are encouraged to do your research before trading or investing in any securities. Positions carry risk of loss of investment principal.
Hive Engine Token #1:SWAP.EOS
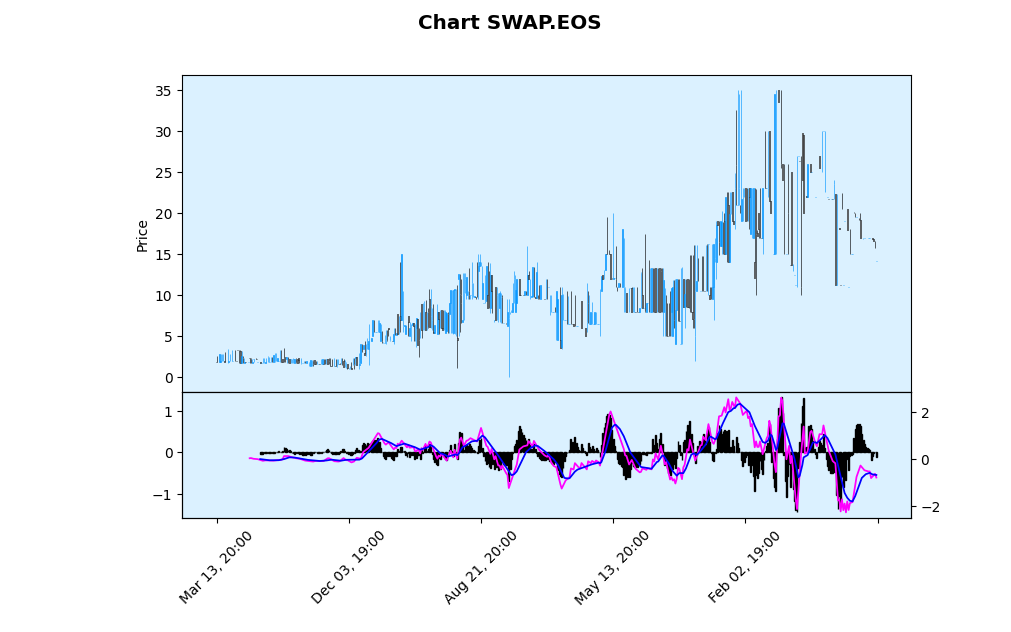
The Moving Average Convergence Divergence (MACD) indicator for SWAP.EOS on a daily chart has shown a bearish signal, the signal line crossed below the MACD Line and the MACD Histogram crossed below the Zero Line in the previous trading day on a daily chart.
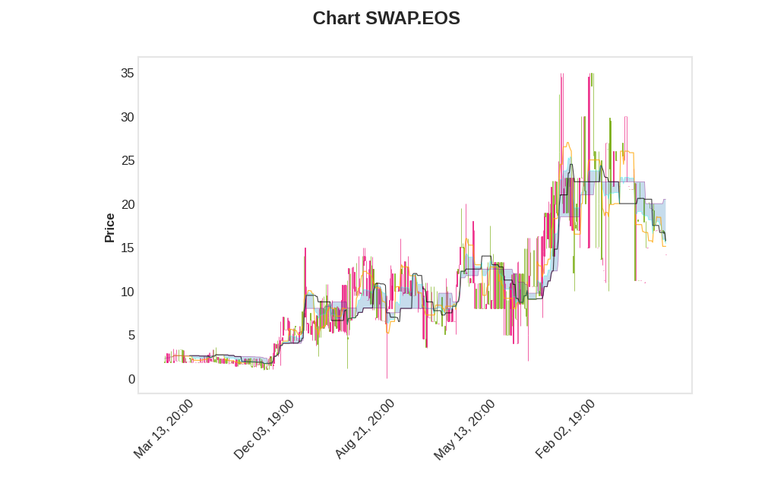
The daily price is below the cloud (kumo), the price is below the Kijun Sen (a measure of the average of the highest high and lowest low over the last 26 periods, which happens to be days on a daily chart), and the Tenkan Sen (a measure of the average of the highest high and lowest low over the last 9 periods, which happens to be days on a daily chart) is below the Kijun Sen. All of this points to a bearish trend.
Hive Engine Token #2:HYPNO
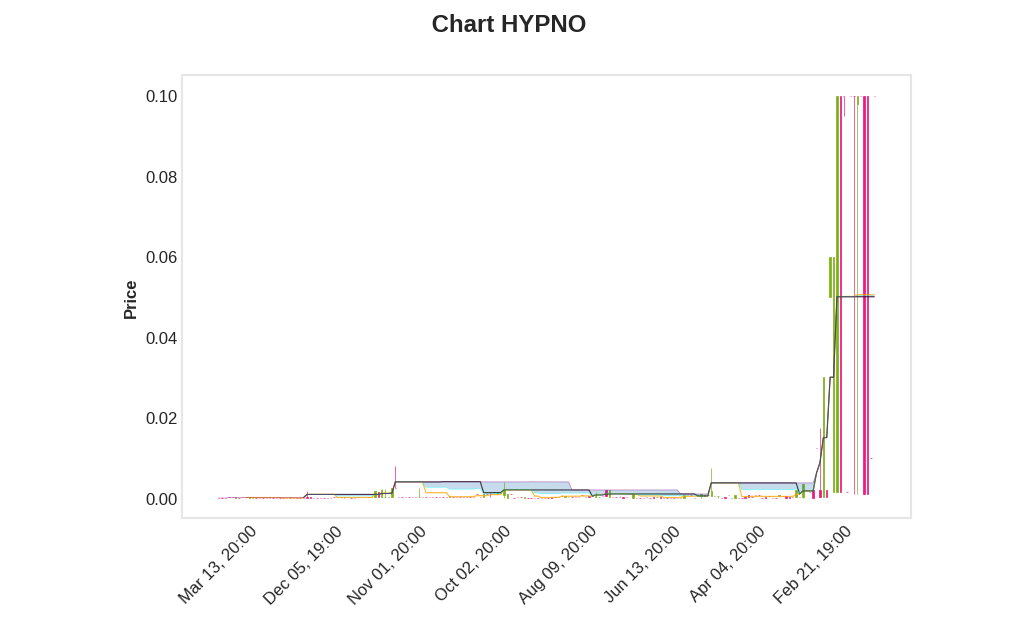
The price is above the cloud (kumo), the price is above the Kijun Sen (a measure of the average of the highest high and lowest low over the last 26 periods, which happens to be days on a daily chart), and the Tenkan Sen (a measure of the average of the highest high and lowest low over the last 9 periods, which happens to be days on a daily chart) is above the Kijun Sen. All of this points to a bullish trend.
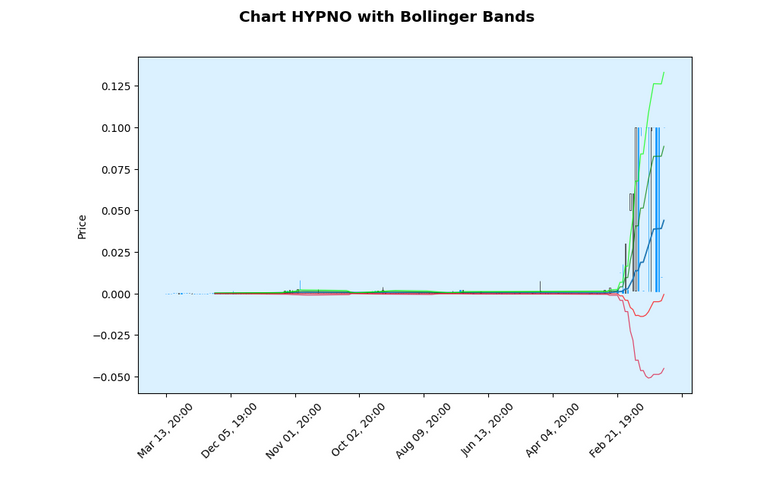
Right now, the daily trend is an upswing and the Bollinger Bands help confirm it as the price is nicely contained within 1-2 Standard Deviation levels above the mean.
Hive Engine Token #3:ALPHA
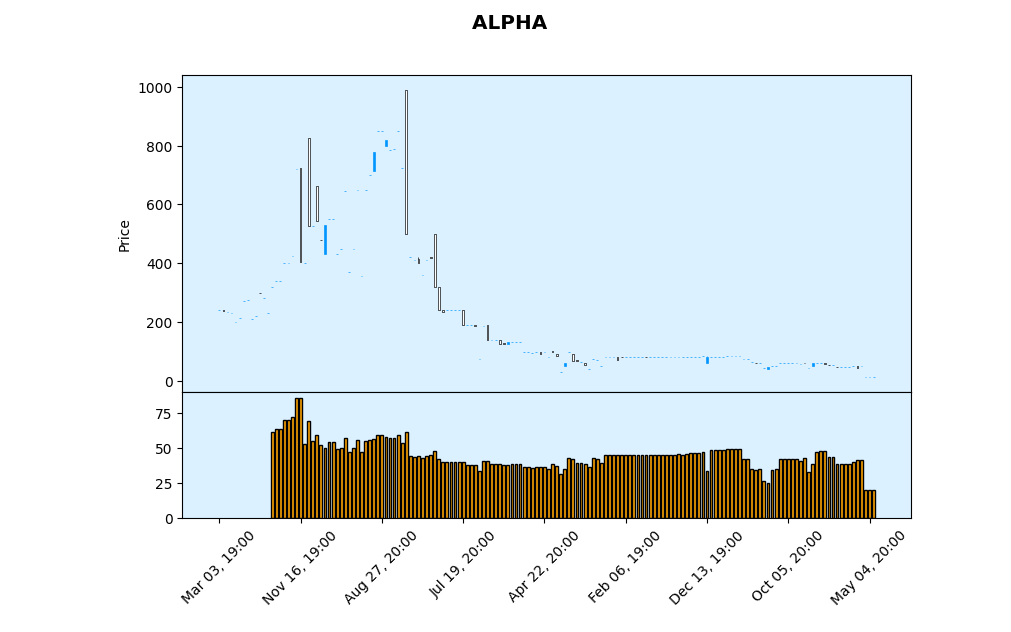
The daily chart of ALPHA has the Relative Strength Index (RSI) dropping below 25 in the previous trading day, which indicates that the token is oversold. This is commonly used in conjunction with other indicators to confirm a possible situation where one would go long on this token. or take profits on a short position.
Hive Engine Token #4:SWAP.BUSD
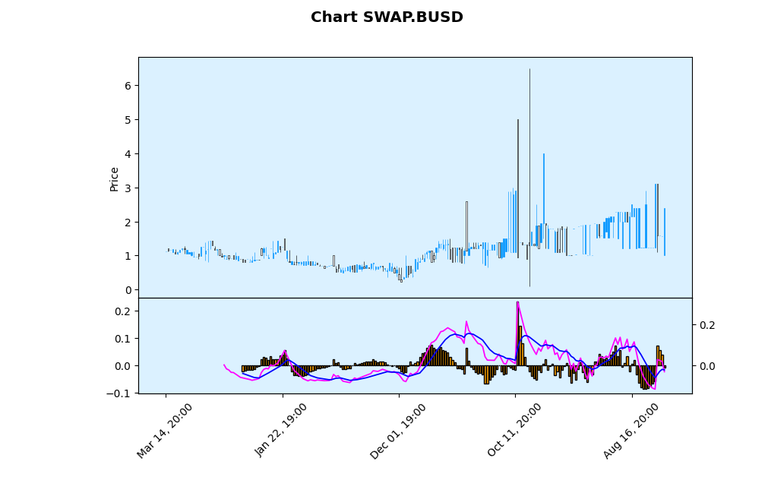
SWAP.BUSD is appearing bearish according to the Moving Average Convergence Divergence (MACD) indicator on a daily chart with the common default settings of a 12 Day Exponential Moving Average less the 26 Day Exponential Moving Average with the 9 Day Exponential Moving Average to be used as the Signal Line. The signal line crossed below the MACD Line and the MACD Histogram crossed below the Zero Line in the previous trading day on the daily chart.
0.00054268 BEE
Congratulations @coincharting! You have completed the following achievement on the Hive blockchain and have been rewarded with new badge(s):
Your next target is to reach 20 posts.
You can view your badges on your board and compare yourself to others in the Ranking
If you no longer want to receive notifications, reply to this comment with the word
STOPTo support your work, I also upvoted your post!
Support the HiveBuzz project. Vote for our proposal!