You are viewing a single comment's thread:
RE: Dashboard, Performance Metrics and More Added to Hive Portfolio Charter
The UI looks awesome! I did scratch my head a bit about not seeing HBD on the Layer 1 Holdings but then I figured it's a stablecoin and doesn't necessarily need its price/performance tracked?
0.00130893 BEE
Also, you gave me another idea. To always show the price of HBD (regardless of what is selected) on tooltips on the USD chart (since HBD and USD are related).
Yes, this would also be another data point to keep an eye on. Maybe arbitrage opportunities could be easily spotted :)
View more
It should be tracked. It isn't for you? You can see it separately by selecting the specific token, and from there "liquid_hbd" or "savings_hbd". But it is part of L1 holdings and in full portfolio.
Look:
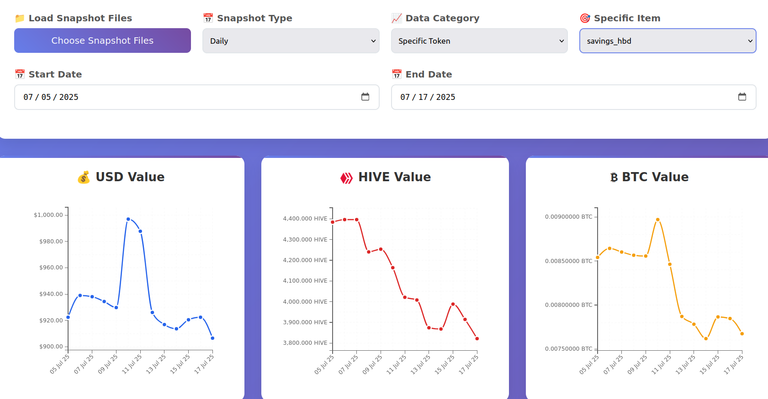
But your comment made me discover that I don't post price of HBD in tooltips. And it is important. As we see in the first chart, it can have a big impact on the value of HBD holdings in USD. That spike on the USD chart is when HBD was $1.084 recently.
Right, that's what I didn't get previously. I think it can be another valuable data point to view how one's HBD +/-Savings progresses over time.
The HIVE chart on the image looks interesting to me, quick way to notice that HIVE's price has been rising steadily as of late.
View more