Dashboard, Performance Metrics and More Added to Hive Portfolio Charter
I kept myself busy this week working on my new tools Hive Portfolio Tracker & Charter, one for back-end, the other for front-end.
While this is still work in progress, and bugs or inconsistent data do still appear from time to time from the Hive-Engine API (and maybe for other reasons still undiscovered), despite using multiple fallback methods and retrials, it is still a very useful tool combination in my biased opinion, which I certainly use and will continue to do so.
It's been exactly one week since I introduced Hive Portfolio Charter, and since then I worked on both ends, but mostly on the front end.
Dashboard and Portfolio Metrics
The dashboard along with portfolio metrics were added this week and will become more powerful as more time passes and more data is collected. Oh, by "data is collected" I mean you collect it as JSON files saved on your computer either automatically or manually (your choice), provided you use Hive Portfolio Tracker. Note that using this tool to generate the input data is not a requirement. You can generate your own JSON files by whatever method you want, and, as long as the same format is used (I gave an example in my previous post linked above), your JSON files will be used by Hive Portfolio Charter, if there is no error when loading them.
Let's have a look at it for my account:
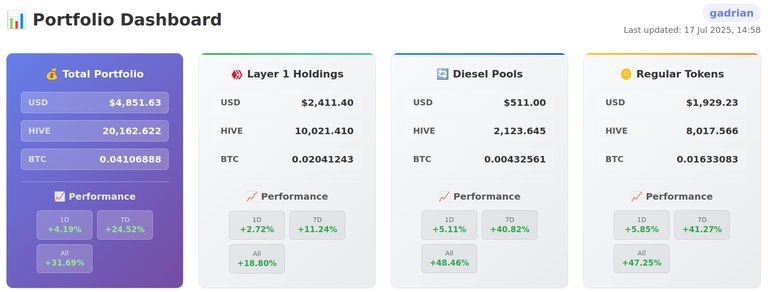
The more data points you have, the more performance metrics you have. They also differ based on the snapshot type (daily, weekly, etc.).
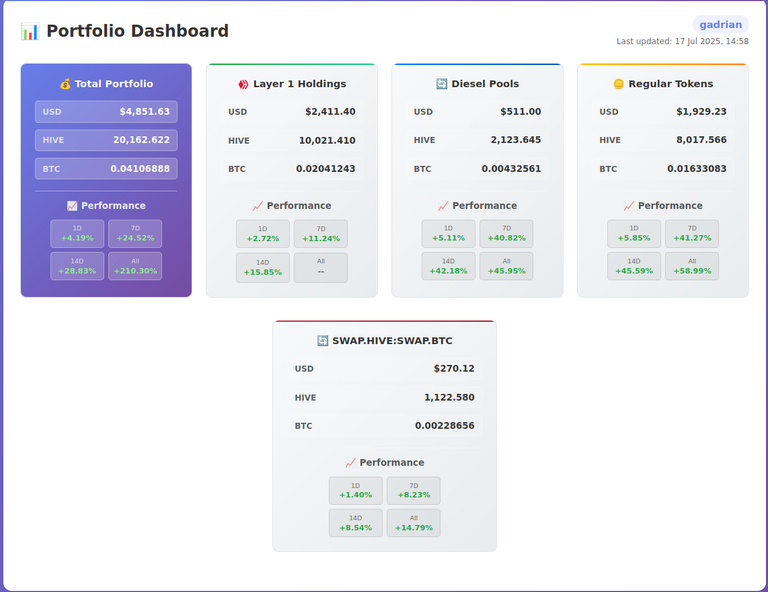
In all cases, on the dashboard we will have the cards with grand total, and L1, diesel pools and regular tokens only. If a diesel pool or a regular token is selected, we have another card specific for it. Like this (zoomed out before the screenshot to fit):
Support for Multi-Accounts
My initial worries were about the consistency of the data when putting together different accounts (that are not part of the same portfolio). I even implemented a condition to only allow snapshots from one account. But in the end, I decided this is the responsibility of the user to feed in consistent data in this case, and it's more important to allow for multiple accounts that usually give the full picture of someone's portfolio on Hive (where both people and projects usually have multiple accounts).
So... there is full support for multiple accounts. I still need to rework a bit the loading method to be able to load files for different accounts without the need to put them together in one directory (as it is now, in this temporary stage or development). I already know how to do it, it should be simple, but didn't have time to do it yet (and probably won't until I come back from vacation).
Support for multi-accounts is on both the dashboard and the chart part. The amounts are simply added for holdings found on different accounts.
Here's an example where I loaded my posting and my staking account on Hive:
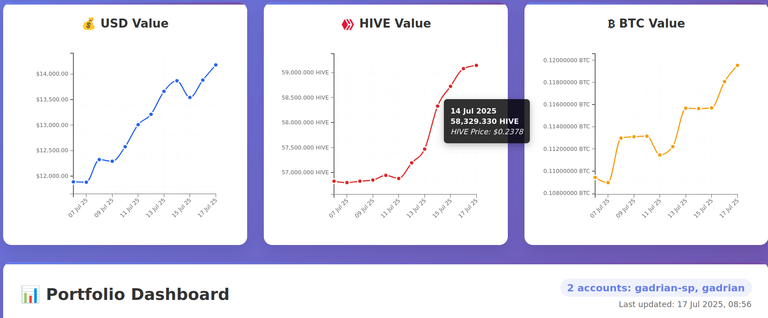
In the above image you can see:
- the 2 accounts loaded: gadrian-sp and gadrian (in the bottom right of this screenshot)
- charts with full portfolio evolution in the selected period
- a tooltip, presenting the date at the data point, portfolio value in HIVE (since we are on the Hive card), and the price of HIVE then (as it was recorded in the metadata of the snapshot)
Since I mentioned the tooltip, let's move to them next, they can be a very useful resource.
What Do Tooltips Show?
Their behavior depends on the chart and the selected options.
For Total Portfolio, Layer 1 Holdings, Diesel Pools, and Regular Tokens, in the USD chart the tooltip shows Date and Value in USD. For the Hive and BTC charts, the prices of HIVE and BTC, respectively, are added for that date, as they were recorded in the snapshot's metadata.
If you select a specific diesel pool, your number of shares of your position at that date are also shown. Like this:

This is quite powerful, as you can "watch" the shares of a diesel pool position grow over time, which I don't think you can do anywhere on Hive.
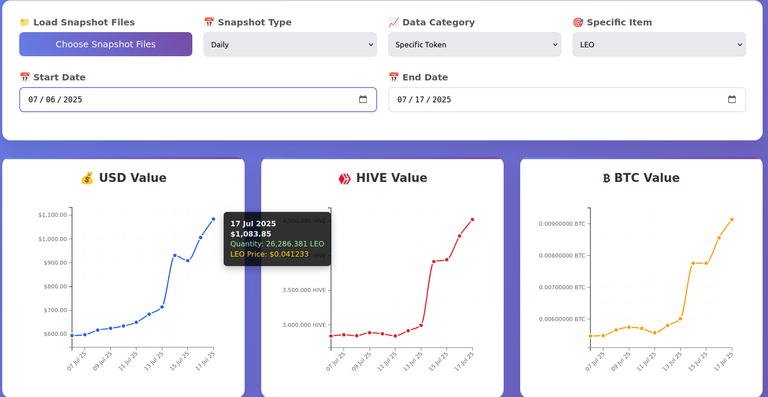
And finally—for the tooltips part—when selecting a token, it shows the number of total tokens and the price of the token, on top of everything else. Like this:
Few of the Fixes Last Week
Unrealistic Price Drops
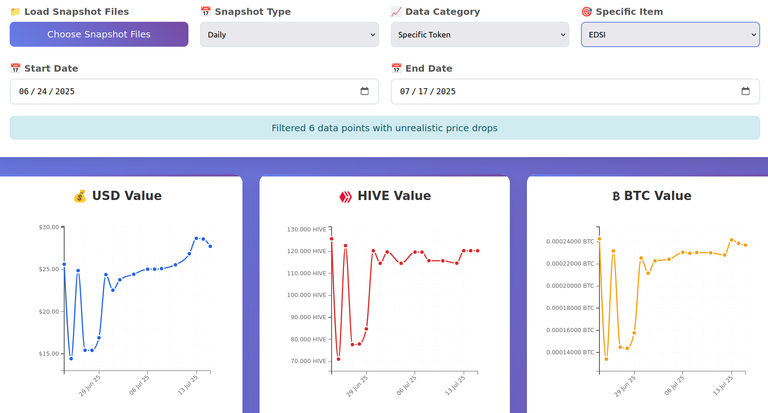
On Hive Portfolio Charter, to avoid the pesky mis-readings from Hive Engine which lead to broken charts (which—from observations—happen every few days, usually on very low-liquidity tokens), I introduced the idea of "unrealistic price drops" over a certain time frame. Starts from -80% from one day to the next for a token, and increases for longer types of snapshots or those involving multiple assets.
When an "unrealistic price drop" happens, which usually (but not always) means the price is zero after being higher the day before, the data point is filtered out and announced to user, with the exact data points filtered out logged on console.
Without the unrealistic price drops, the chart looks much better, even though it might be missing a few in between data points when reliable data couldn't be collected.
Here's such a case where it happens regularly:
By the way, although I thought I fixed this it seems I didn't: after some data points are filtered out for unrealistic price drops, if you select another option, the same filtering is kept, it isn't reset. It's on my things to fix. Until then, you can avoid it by refreshing and re-loading snapshot files, when it happens.
Automatically Adding Diesel Pool Tokens to the List
If your list of tokens to check didn't include all the base tokens of all your diesel pool positions, there was no price for those tokens. That was an oversight on my part, which I discovered when I ran the tracker in debug mode and saw why my LEN-LENM diesel pool didn't show up.
So... nothing for you to do (if you use the tracker). I now add automatically the base tokens of every diesel pool that aren't already in the list of tokens to fetch from Hive-Engine.
Added Delay Between Accounts on Manual Snapshots
To play even nicer to the Hive-Engine API, I added a 5 second delay between all accounts that are manually snapshot-ted, using my shell script. I play very nice here, with both delays and caching of previous data that have been requested, as this was one of my priorities. But forgot to add a delay between accounts on the manual snapshots shell script and fixed that this week.
Feedback?
I need your feedback and ideas! I'm sure there are things I don't think of right away, or that elude me. The idea about the dashboard/performance metrics came from @davideownzall last week, even if he didn't say it quite like that. I added my own ideas. The AI had its own contribution, although I had to fight big battles to make it what it is now. Anyone who thinks you just tell the AI to build something and it does, doesn't realize how many times it gets it wrong and how much hand-holding it needs on the way, even if it may provide a working MVP right out of the gate (not always).
Posted Using INLEO
Now it looks way better!
I'll add complexity, add a function to "predict" the value and growth based on previous performance, with a fixed token price or custom
There is something nice to build from your idea. 😀 I wouldn't venture to build a predictive model based on passed performances. As they say, they are no guarantee of the future results. But a sort of compounding calculator would be enough in certain cases. There are other updates that would have priority, though.
haha i'm glad i give you something to work on... compounding calculator, yea like for hive or hbd
The tool is looking quite nice. I am wondering, is there a way to add in what you earn from the diesel pools? Some of them are paying rewards so it might be nice to see how much you are earning and if the numbers go down, then you might want to figure out which pools you might need to make changes to.
Nah, sorry! Too complicated to track rewarded tokens as well. Too much data to save in json files daily. The json files will add up to respectable sizes collectively in time, even without that.
The UI looks awesome! I did scratch my head a bit about not seeing HBD on the Layer 1 Holdings but then I figured it's a stablecoin and doesn't necessarily need its price/performance tracked?
It should be tracked. It isn't for you? You can see it separately by selecting the specific token, and from there "liquid_hbd" or "savings_hbd". But it is part of L1 holdings and in full portfolio.
Look:
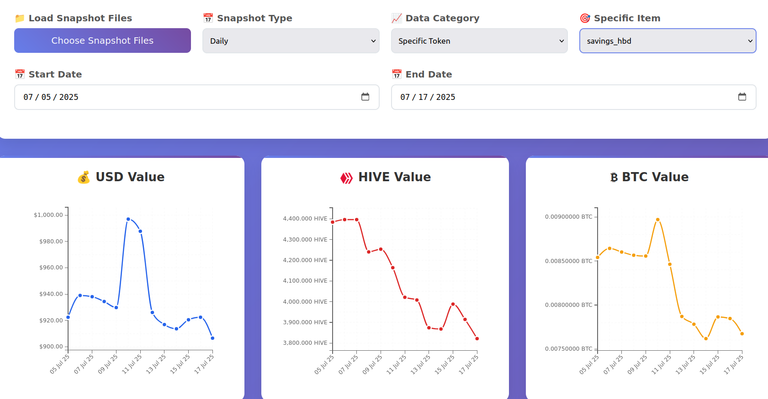
But your comment made me discover that I don't post price of HBD in tooltips. And it is important. As we see in the first chart, it can have a big impact on the value of HBD holdings in USD. That spike on the USD chart is when HBD was $1.084 recently.
Right, that's what I didn't get previously. I think it can be another valuable data point to view how one's HBD +/-Savings progresses over time.
The HIVE chart on the image looks interesting to me, quick way to notice that HIVE's price has been rising steadily as of late.
View more
Also, you gave me another idea. To always show the price of HBD (regardless of what is selected) on tooltips on the USD chart (since HBD and USD are related).
Yes, this would also be another data point to keep an eye on. Maybe arbitrage opportunities could be easily spotted :)
View more
It is amazing to see the results of constant evolution and your learning process.
Well... I had a solid foundation. Haven't used it in a pretty long time, but I haven't started fresh.
What's this? Software developer liaising with users directly. It can only end in tears...
Sorry, tiers
Tiers of reliability. The developer is actually using the product.
Tiers of speed. No weekly development meetings, user surveys, productivity reviews, etc. Just get on with it.
Tiers of quality. It's @gadrian FFS.
Sorry about that, mate. I don't have enough of a portfolio yet to be worth analysing. But my plan to slowly build one by commenting on influential bloggers is beginning to take shape. 😂
!BBH
I wish had made the tracker tool which takes snapshots more user-friendly. Who knows? Maybe I will find a different solution some day, if I'll get myself to rebuild it in a different way.
You can find interesting things by analyzing portfolios of ANY size. But I understand if you think it's not worth it yet for you yet.
Thanks for your comment!
Some of us were talking about something like this just yesterday. I will definitely check into this for the LPN info.!PIMP
Awesome! More eyes on it would help and possibly fix some of the issues sooner, when they are discovered. I also felt something like this was really missing on Hive. For my own use, at least, but I'm pretty sure others would find it useful too.
This post has been manually curated by @bhattg from Indiaunited community. Join us on our Discord Server.
Do you know that you can earn a passive income by delegating your Leo power to @india-leo account? We share 100 % of the curation rewards with the delegators.
100% of the rewards from this comment goes to the curator for their manual curation efforts. Please encourage the curator @bhattg by upvoting this comment and support the community by voting the posts made by @indiaunited.