Evaluation of the Quality of PHCN Service Delivery in my Area
Introduction
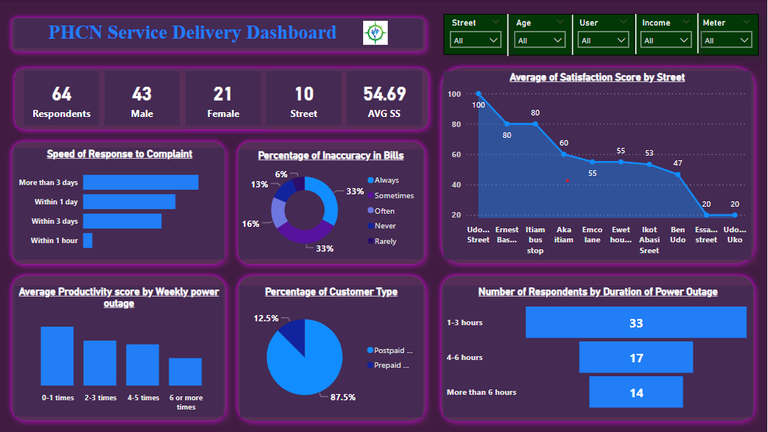
This dashboard evaluates customers's sentiments on the quality of service delivered by Power Holding Company of Nigeria based on feedback from 64 people distributed across 10 streets located in areas surrounding the Nwaniba roundabout up to the two-lane traffic light, all by Oron Road, Uyo, Akwa-Ibom State, Nigeria.
The survey was carried out between the months of June and July 2024.
Tools used
Google form
Google sheet
Microsoft Excel
Microsoft Power BI
Process
After visiting Port Harcourt Electricity Distribution Company (PHEDC) social media handles across various platforms to consume several customers's comments on many of their public posts, I was able to discover trends and, as a result, unlock key demographics and metrics that enabled me to draft a hypothesis that could aid the evaluation of the quality of their service delivery.
Note: PHEDC is the subsidiary of PHCN that manages electric power distribution in most states in the South-South Region of Nigeria, which includes the ones in view.
With the help of Google Forms, I went further to prepare a questionnaire covering questions that will later aid in the testing and analysis of the already-draughted hypothesis. The responses to the questionnaire were collected in a structured format in Google Sheets and later downloaded to my local computer storage as an Excel file. The file was opened in Microsoft Excel, where basic cleaning, that included the removal of blanks, unnecessary columns, and rogue and invalid data, was carried out.
The dataset was later pulled into Power Query in Power BI, where I carried out extraction, transformation, and loading (ETL). The transformed data was loaded into the report canvas, where further analysis was carried out and the inserted visualisations were prepared to unlock insights discussed below.
Key insights
Respondent Demographics

Gender distribution: The majority of the respondents were male (43 males, 21 females).
Street coverage: The respondents were spread across 10 streets, surrounding the area earlier stated.
Average satisfaction score (SS)
How satisfied customers are with the service provided by a company gives clear insight into their sentiments on how they rate the quality of that company's service.
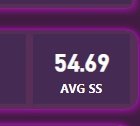
Based on this, the customers's satisfaction level was scored on a scale of 20 to 100. And it collectively averaged 54.69. This finding indicates a moderate level of satisfaction. Which further suggests that there are metrics and demographics where the customers are giving the electricity distribution company positive reviews, and there will surely be areas where the reviews are negative.
Average Satisfaction Score by Street
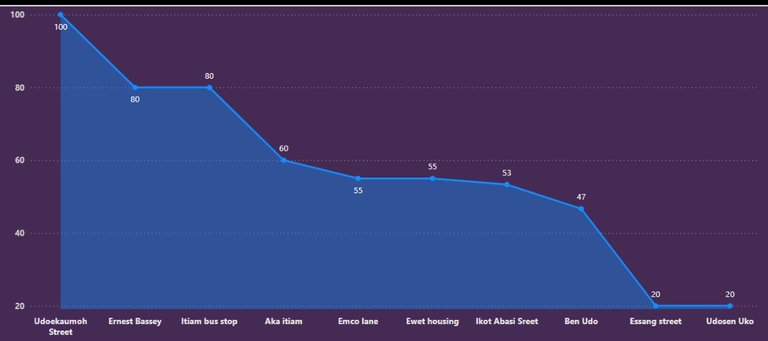
The average satisfaction score varies significantly by street, with the highest score (100) at Udoekaumoh street and the lowest scores (20) at Essang and Udosen Uko streets. Clearly, the highest and lowest scores do not reflect the reality of most of the streets. Careful observation shows that the average satisfaction score for most of the streets is between 47 and 60. And that reflects the sentiments of most of the respondents.
Speed of Response to Complaints
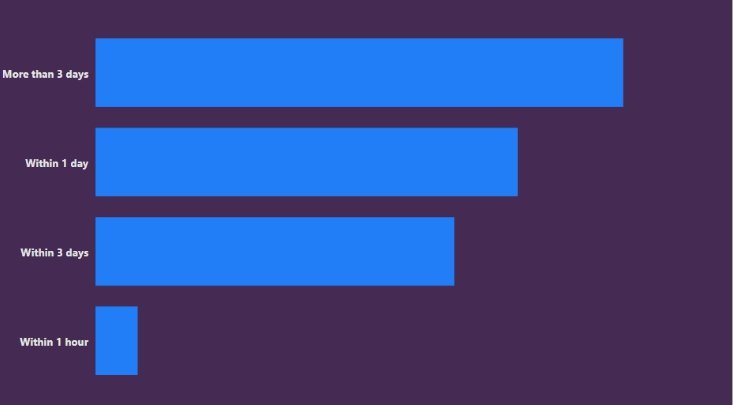
The majority of the respondents voiced that complaints are resolved in more than three days, with the fewest number saying that they're resolved within an hour.
This indicates a lack of rapid response to customer complaints. And it may lead to low customer dissatisfaction.
Percentage of Inaccuracy in Bills
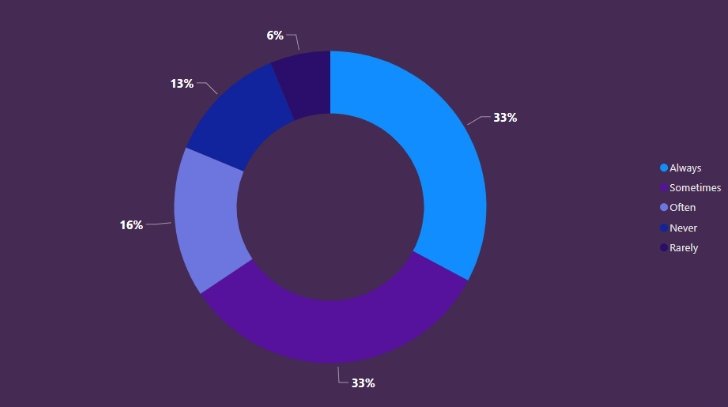
There's a significant issue with billing accuracy. A large portion of respondents (33%) report that their bills are sometimes inaccurate, with another 33% saying they are often inaccurate. Filtering the report by meter will reveal the cause of the inaccuracies.
Percentage of Customer Type
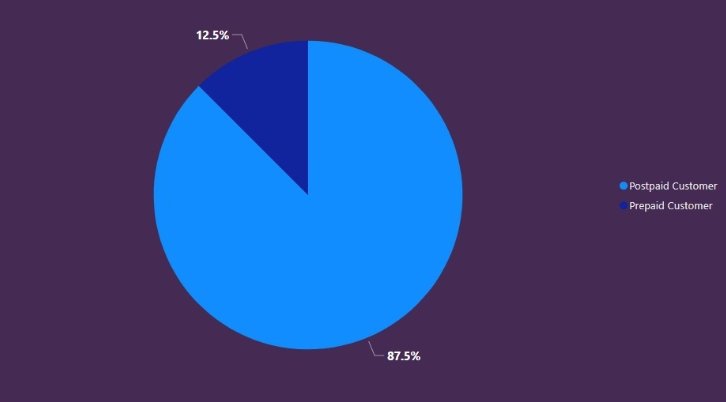
The majority of the respondents (87.5%) are postpaid customers, while a smaller percentage (12.5%) are prepaid customers.
The issues with billing accuracy are only related to postpaid customers. Filtering by meter type reveals that the billing inaccuracy experienced by the majority of the respondents is peculiar to only the postpaid customers, who are also the majority.
Also, it's only one street (Ewet Housing Estate) that has respondents who are using prepaid meters.
Average Productivity Score by Weekly Power Outage
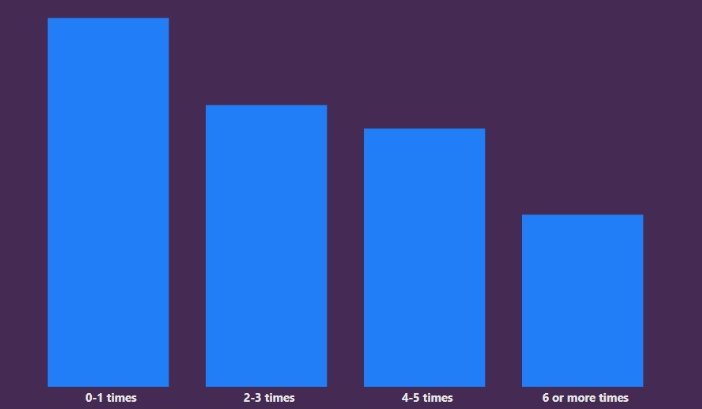
Productivity is highly affected by the frequency of power outages. As outages become more frequent (4-5 times or more), productivity scores decline significantly, indicating that frequent outages have a negative impact on customer productivity.
Number of Respondents by Duration of Power Outage
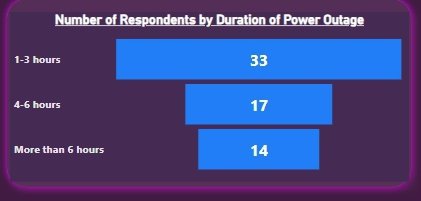
The most common duration of power outages experienced by respondents is between 1 and 3 hours (33 respondents).
Fewer respondents experience longer outages of 4-6 hours (17) or more than 6 hours (14). This shows the metrics where the respondents are giving PHCN service delivery the most positive review.
Conclusion
Customer Dissatisfaction: In general, there is a moderate level of dissatisfaction, particularly with delayed complaint resolution, frequent power outages, and billing inaccuracies. These issues are more pronounced on certain streets, leading to varied satisfaction scores.
Impact on Productivity: Frequent power outages negatively impact customer productivity, which could further influence their satisfaction levels.
To generally improve satisfaction and thereby receive a more positive rating from customers, PHCN should focus on reducing the time it takes to resolve complaints, improving billing accuracy by making prepaid meters available, and reducing the frequency and duration of power outages.
This will also help the nation, as people will become more productive.

Congratulations @mmykel! You have completed the following achievement on the Hive blockchain And have been rewarded with New badge(s)
Your next target is to reach 19000 upvotes.
You can view your badges on your board and compare yourself to others in the Ranking
If you no longer want to receive notifications, reply to this comment with the word
STOP