Help from GPT-4 to give you this tool to track Hive-Engine token prices
Ok. I did what the wise today would do. I paid for use of GPT-4!
It costs USD 20 per month, so I better make good use of it... and hopefully recoup some of that investment through my post rewards.
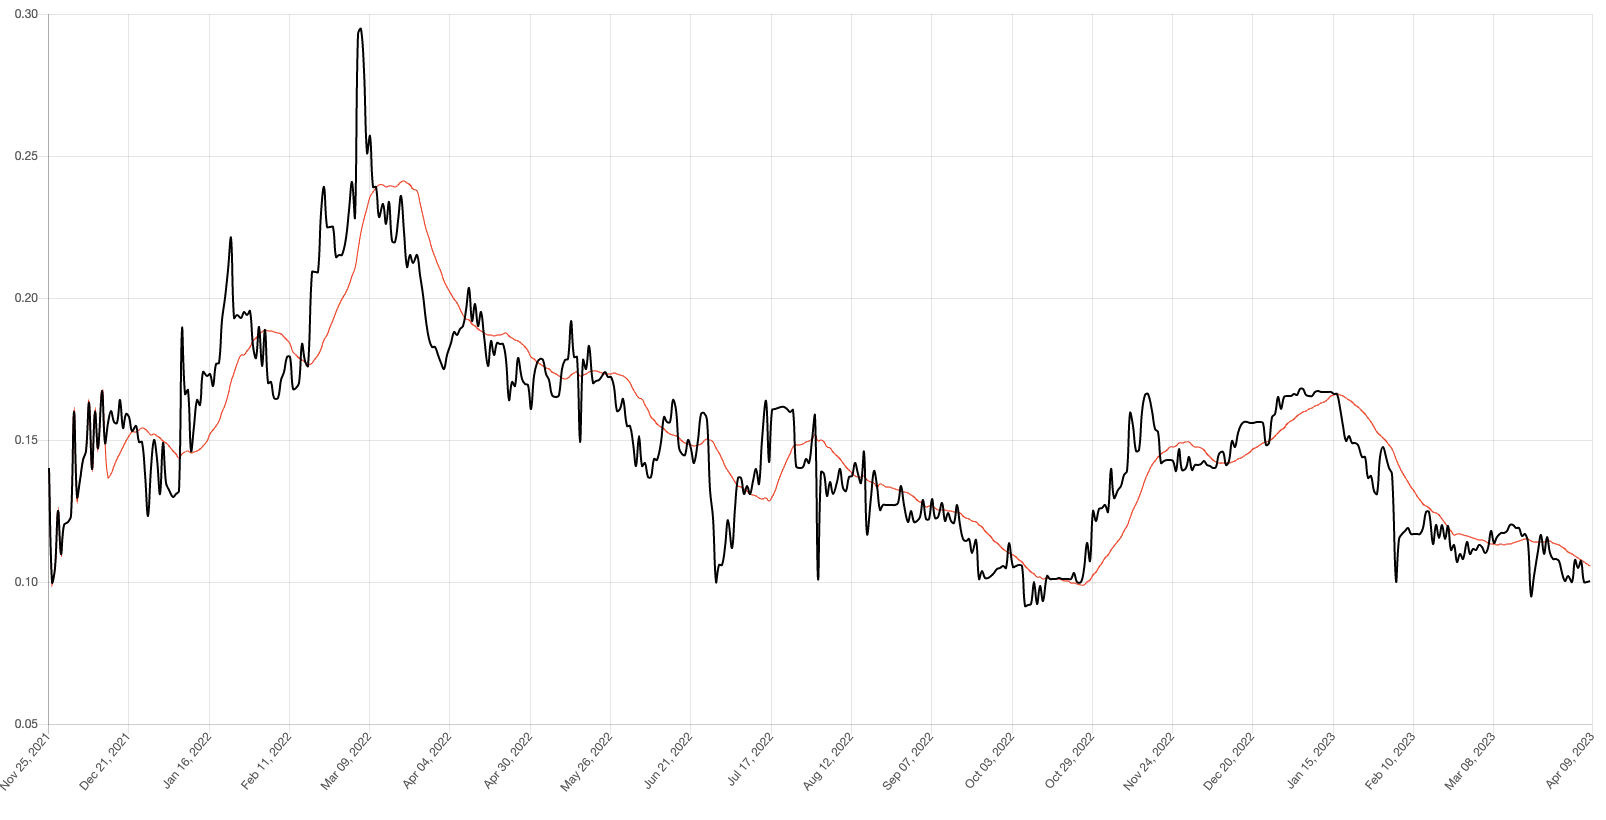
One of the first things I did is to improve on this tool which shows Hive layer 2 token prices and SMA that I made and share on a post a few months ago: hhttps://cryptothesis.github.io/SMA_JS/LEO_SMA_v2.html
Github told me it is 8 months! I had been sleeping on it for that long.
I wanted to fix the dates display on the x-axis but I didn't know how. Previously it was some UNIX numbers...
It's finally done with the help of ChatGPT.
The dates are fixed. See: https://cryptothesis.github.io/SMA_JS/LEO_SMA_v3.html which shows that the dates are nicely shown.

Since I didn't quite like the look and feel of the interface, I asked ChatGPT to beautify it through some CSS magic.
You can see that latest version here: https://cryptothesis.github.io/SMA_JS/LEO_SMA_v4.html
Of course, I thought of asking it to write this post for me, and I did. The result is shown below, which is too good to be my style and knowledge. I left it there but wrote the first part up to this point anyway.
Below written by ChatGPT based on my broad ideas.
Hello everyone!

I'm thrilled to share with you an exciting update on the SMA Charting Tool that I've been working on. With the help of ChatGPT-4, a cutting-edge language model by OpenAI, I was able to improve the code, making it not only more visually appealing but also fixing a significant issue with the x-axis.

Before I dive into the changes, I'd like to mention that using ChatGPT-4 to assist in this task required some background knowledge in JavaScript. Fortunately, I have experience in this area, which allowed me to effectively communicate with the AI model and implement the suggested improvements.

Now, let's dive into the changes!

Making the Chart More Beautiful
First and foremost, I wanted to enhance the visual appeal of the charting tool. ChatGPT-4 provided me with valuable suggestions on how to use CSS to give the page a more modern and clean look. By using Google Fonts, we brought in the Roboto font, which greatly improved the overall appearance of the text.

Additionally, we added a touch of color and subtle shadows to various elements, including the form and canvas, to create a more professional look. The result is a visually appealing charting tool that not only functions well but is also pleasant to look at.

Fixing the X-Axis
Previously, the x-axis of the chart displayed confusing numbers that didn't provide any meaningful information. With ChatGPT-4's guidance, I was able to modify the code to display dates instead. This change has greatly improved the usability of the chart, making it much easier to interpret and understand the data being presented.

To achieve this, we leveraged Moment.js, a popular JavaScript library for handling dates and times. By integrating this library, we were able to format the x-axis to display dates in a human-readable format, making the chart significantly more user-friendly.

Final Thoughts
The improvements made to the SMA Charting Tool highlight the incredible potential of AI-powered tools like ChatGPT-4 when combined with human expertise. In this case, my background in JavaScript, together with the AI model's suggestions, allowed me to create a more refined and useful charting tool.

If you have any ideas for an app that utilizes data from the Hive blockchain and needs some assistance, please feel free to leave a comment below. I'm always eager to explore new projects and would be happy to help bring your ideas to life!

Happy coding!

P/S: This is not financial advice, and please do your own due diligence before investing.
If you read this far... and if you are a like-minded Hiver who is on the path to learning more about Hive and crypto investing, and if you like to be tagged when I write such posts, I welcome you to leave a comment below and let me know. We can form an alliance to support each other's growth.
You might be interested in this post, @thatkidsblack, @graciousvic, @peniel2010, @deflacion, @jacoalberts, @young-kedar, @svanbo, @sumotori, @zakludick, @poplar-22 and @hankanon!
Posted Using LeoFinance Beta

https://twitter.com/1533275630502313984/status/1644822355401908227
The rewards earned on this comment will go directly to the people( @cryptothesis ) sharing the post on Twitter as long as they are registered with @poshtoken. Sign up at https://hiveposh.com.
Ahaan, I'm pretty sure this investment of 20$ is worth it and you will make sure to make full use of it. Sadly I can't afford it at this time, but using GPT3 is also very beneficial for users like me who can't afford to spend 20 $.
Wow, that's quite inpressive. For some time i wanted to look into Chat GPT but I didn't get to it. But I thought it was a free tool? You say you'r paying 20 dollar per month for it?...
!PIZZA !CTP
Yes. But there is also the free version
What exactly made you going for the paid version? !PIZZA
If you pay 20 Dollar's subscription fee, they will give you additional features. And because of these features you can collect information with more detail. Many things have become easier to understand because of Chat Gpt. Chat gpt 4 is more powerful than his last version.
Yes, indeed. It is very powerful.
Sure
Wow, that is quite nice to see. It looks like it is able to pull up and parse all the historical data for things on Hive Engine.
Posted Using LeoFinance Beta
thanks!
Nicely done and looking good. I'm sure the next step is going to be requests by folks to add more metrics just to go full TradingView. I just added your tool to the HiveWiki at https://crrdlx.websavvy.work/wiki/doku.php?id=wiki:layer-two
cheers mate!
That tool is very excellent! Thank you for sharing and letting me try it out. !PIZZA
The earlier version they had was not correct this one me and my friends have also used it gives much better results the way it has given you. Investments are always risk, a person should see it himself. It is a good thing that has come in time and the world is using it a lot.
This tool allows tracking of Hive-Engine token prices. It provides up-to-date market prices for each token listed on Hive-Engine, giving users the latest rate for each token to make informed decisions. Additionally, users can access historical data and charts to review the price movements of each token. This tool also provides built-in analysis and notifications to ensure users are always aware of the latest Hive-Engine token prices.
no notification.
and not to be relied on for investment decisions.
$PIZZA slices delivered:
darkflame tipped cryptothesis
@svanbo(2/5) tipped @cryptothesis (x2)