Bitcoin price 301225
let me preface this to say I am not a trader, I don't know technical analysis, but I am making observations and drawing trend lines, sine waves and now using emojis to draw all over Bitget.
The first half of 2026 is looking like higher lows and lower highs, and now that Bitcoin has broken support over 90k I am waiting to see how long BTC trades over 72,000 USD.

https://www.bitget.com/trading-bot/spot/BTCUSDT
The red sine waves that I have drawn are from the heavy drawdown in November 6-21st 2025, contrasted with the green sine waves (with the arrows up) that are from December support.

I have added an extra pink sine wave to show support from mid December 19-22nd 2025. The April 7th to May 6th support going back pre-pump is represented with this low green sine wave, and I lightened the Early and Mid Dec support green lines also.

I don't know what is going to happen in 2026,
but I suspect we are in a roller coaster ride
down from the $126,272 ATH

Ok enough with the crazy art charts, let's look at the data for a moment.
57.38% of the market cap of cryptocurrencies is just in Bitcoin. How much of the value of altcoins are tied to the price of BTC? Which altcoins will 'gain value' vs BTC in 2026?
Which stablecoins will have the highest market supply in a year?
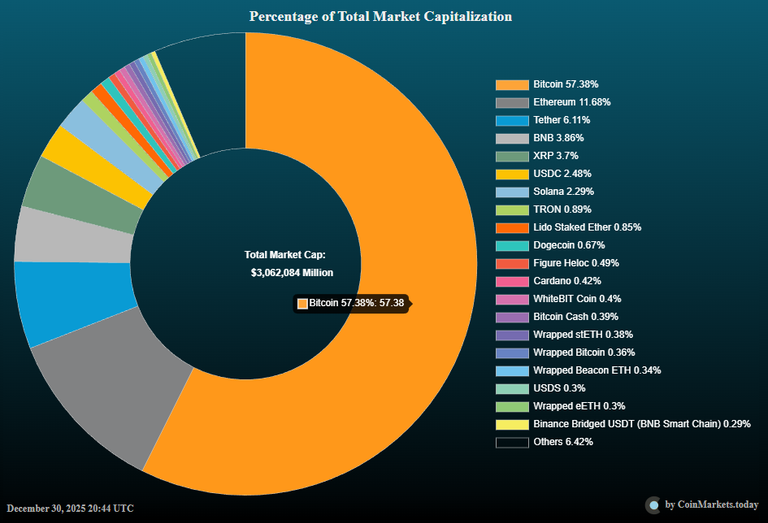
Does that say 3.062 Trillion dollars total in the top cryptos?
BTC = $1,755,780,840,798 USD market cap
ETH = $357,170,995,583 USD
USDT = $187,115,119,108 USD
BNB = $118,180,140,855 USD
XRP = $113,147,020,067 USD
USDC = $76,004,264,004 USD
SOL = $69,862,087,303 USD
TRX = $27,108,443,516 USD
STETH = $26,051,368,938 USD
DOGE = $20,604,080,211 USD
Just 3 billion short of 3 Trillion in those 10 tokens alone.

What if Bitcoin keeps going up?
Because there are only 19,969,350 of them, but far less in circulation.

C8FF00 on Dec 30 2025 Stock to flow seems to suggest that BTC is past the cycle top, and while we may be on the way down there is still some possibility for pumps to lower highs as shown below. One thing to note however is that past cycles stock-to-flow was higher than the orange line,

above stock to flow, and this cycle the price is significantly below it.
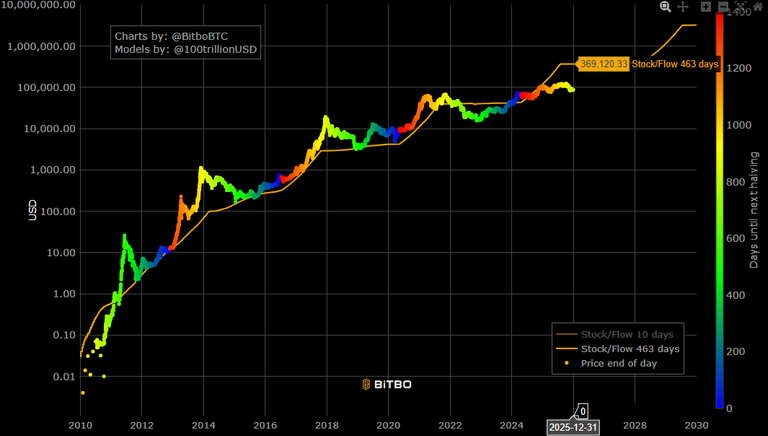
https://charts.bitbo.io/stock-to-flow/
What does this mean? Is it all over for Bitcoin? Or like every cycle is this just the beginning? Will we look back on $87,949 USD Bitcoin the way I look at my old posts from 2024?

The holidays are over, time to budget for 2026.

Are you ready for the new year?