Bitcoin price 090725
On social media everyone is celebrating $111,000K which is fair.
https://bitcointicker.co/stamp/btc/usd/3Mth/
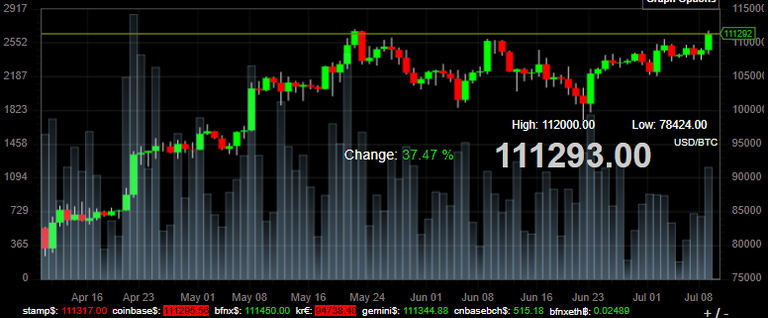
https://bitcointicker.co/stamp/btc/usd/3Mth/
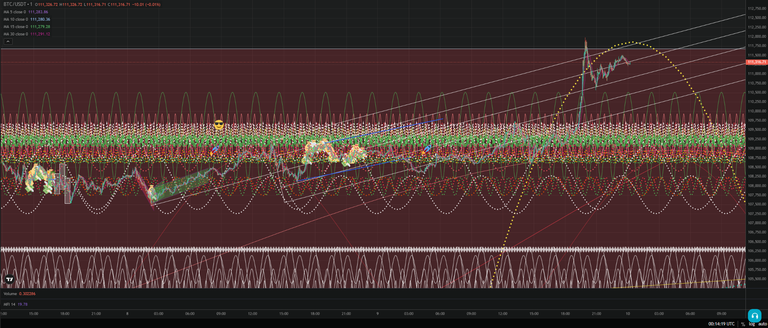
I find it interesting how the breakout aligned with this yellow sine wave I drew.
https://www.bitget.com/trading-bot/spot/BTCUSDT

I am actually not sure where this yellow line on the Minute candles started.
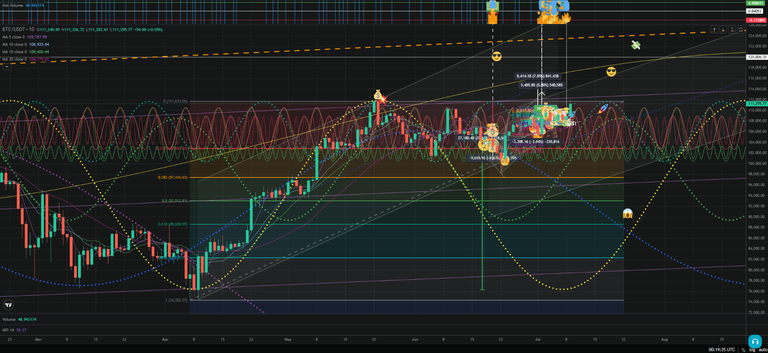
Here's the Daily candles, and you can see how this run began around April 8th from 76k.
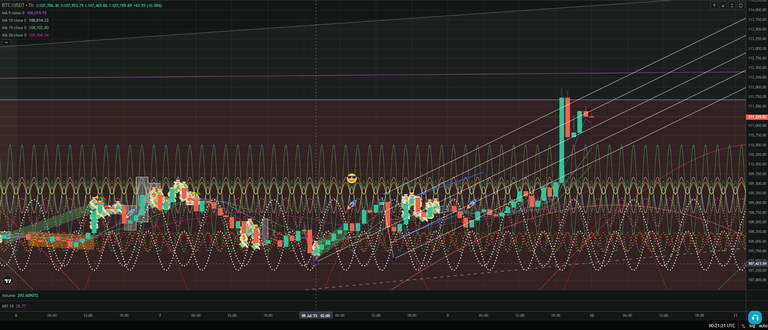
The hourly candles take this particular rise back to July 2nd when BTC touched 105k
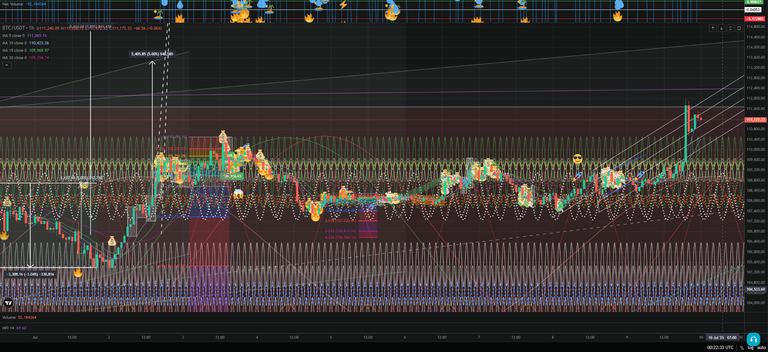
I know it looks a bit messy with all these overlapping sine waves but they are more coherent than my charting from last summer for sure. How high will BTC go this summer? I noted last week that BTC only had to go up +5% from 107k to break 112k but here we are, up +5.69% (nice) from 105k and all the attention will certainly bring buyers to the yard. I need more BTC!

Bitcoin sold off a bit over the past 3 hours, down to the low low price of $110,879 USD
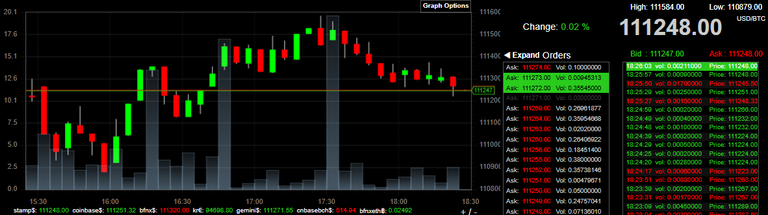
https://bitcointicker.co/stamp/btc/usd/3hr/
Currently $111,248 USD
or $152,166.29 CAD, $100 = 0.00065717 BTC
(Countdown to September 1st 2025)

Still patiently waiting for 250k.
Could be just a few years away! Maybe less, maybe more.
1007 days until Reward-Drop ETA date: 13 Apr 2028
Hmmm interesting 3:1 strategy