BITCOIN ANALYSIS, 2023 Week 12 [EN/ES]
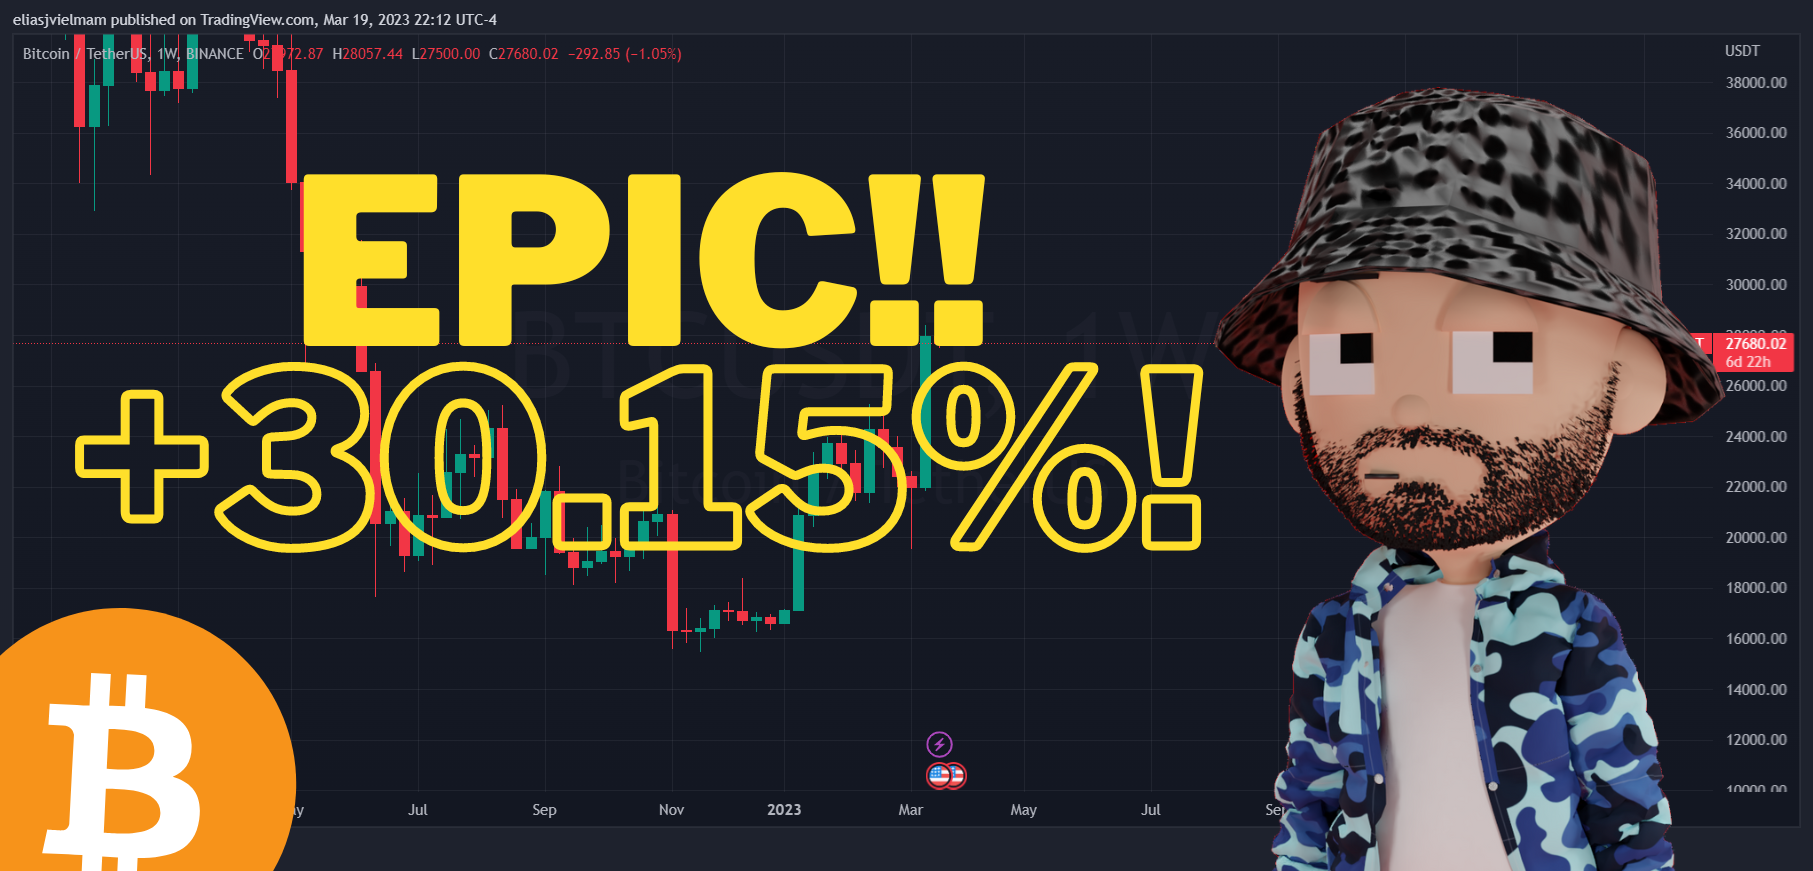
A fun ride indeed!
An historic week, and the long-awaited profits...
Directional Bias
Hello everybody from Hive and LeoFinance communities! I wanted to share with you my personal view and trading plan given the last price action shown by Bitcoin, and all every altcoin consequently. Let's go!!
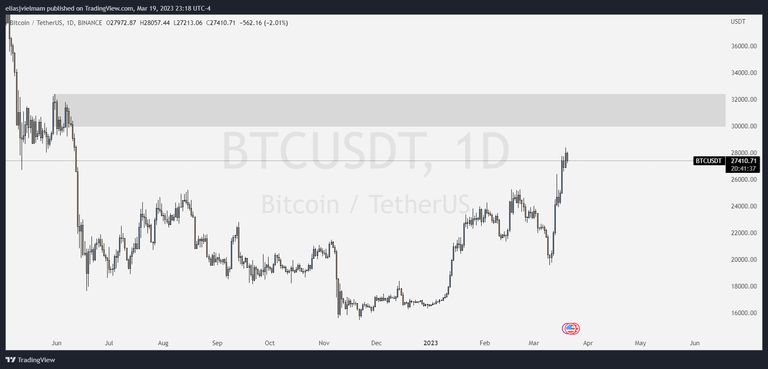
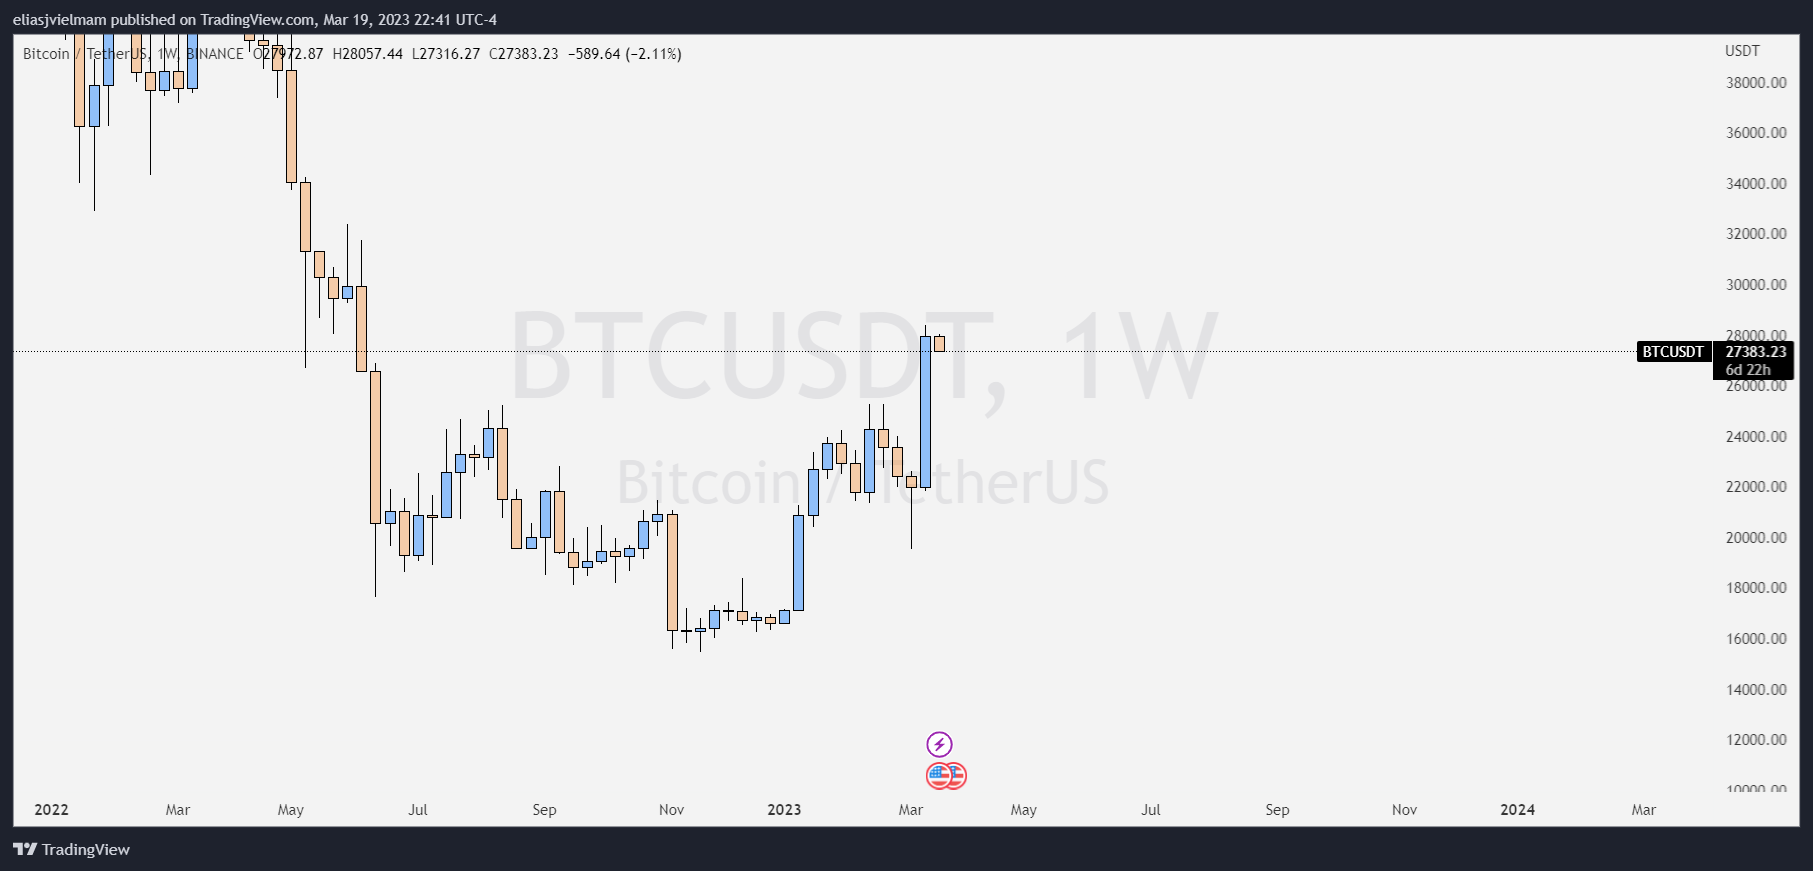
The Weekly Chart
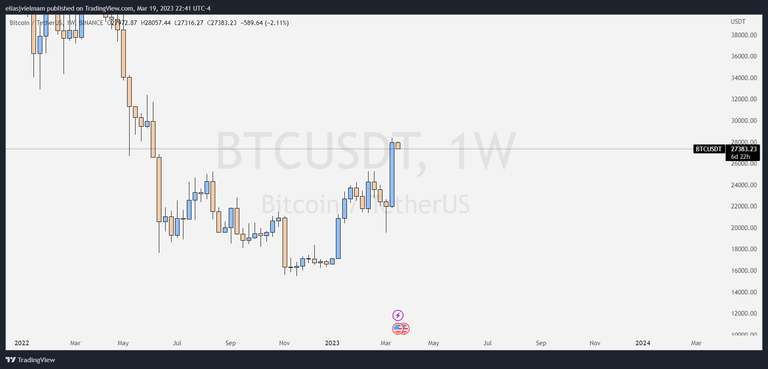
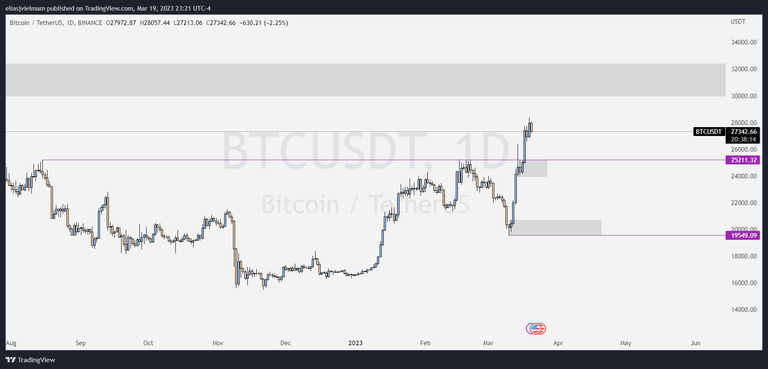
So from a Weekly perspective we may see a very clear and strong rejection to the previous range zone ($21480-ish - $25211.32) and a break above structure.
I don't tend to do bold statements just like that, but I truly believe that this impulse and break of structure marks the end of the bear cycle... ahead of the halving calendar, so this leads me to think of the next ATH... probably it's gonna be epic, and more likely beyond any prediction. But I'm rushing. Let's go back to the charts...

Basically, we see the price strongly piercing through the previous range highs. In TA this is called Break of Structure and marks a shift in the market sentiment. Being these Weekly charts, it is not less than significative.
So far, the overall bias is bullish.
Given the circumstances the question everybody asks is "how much more the price is rising?"
To answer this question I'm gonna use two main principles:
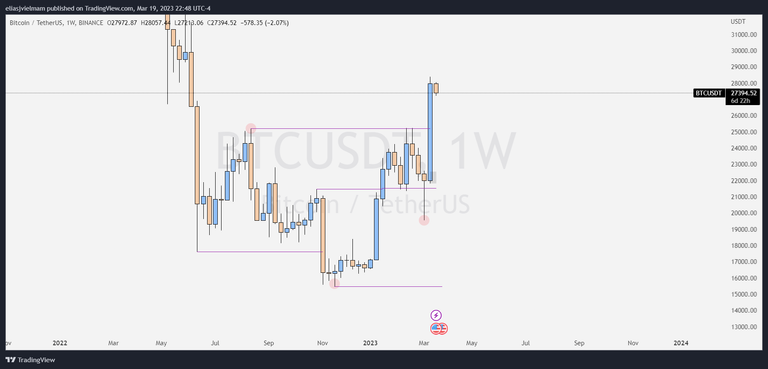
The first one and the most strong-reliable one, and clearly visible with our naked eyes: OB level.
Without going into a deep-complicated analysis, we may see the movement downwards that brought us to these lower range had a "pause" - this is a bullish small candle in the middle of the big downward movement. This pause is known by many names: DBD, Base, or OB.
It is a zone of orders concentration, and more likely, a zone of interest for institutions to sell. A reaction to this zone could lead us back to the previous range.
Similarly, in order to continue the movement upwards, it is necessary to see a pierce through this zone.
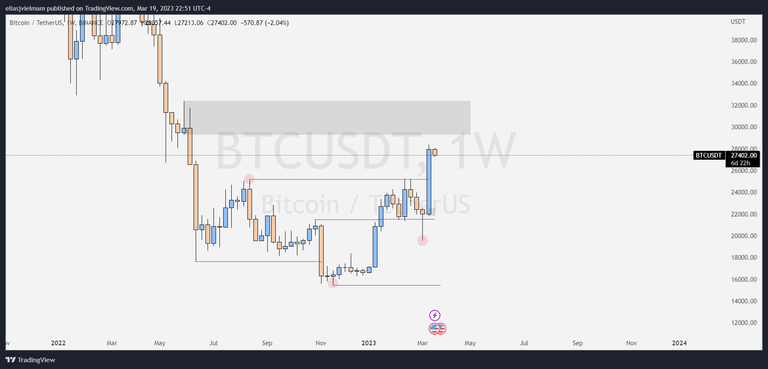
The second principle is a little bit too technical, so without getting too much into it, I'll just show it to you. It is named Dominant Break.
It uses different key mathematical levels within the Fibonacci sequence to determine zones of high probability movements, this mainly due to the fractal nature of markets.
If you look closely, the two fractal zones from the Dominant Break are the high (now intermediate) range, and the new higher zone. This is confluent with the idea to see a reaction to the OB zone.
Using these two easy techniques we get the main bias or macro-directional idea:
*the price is rising this, and maybe next week probably consolidating in the new range area around $28300 - and $30420 before deciding what to do next.
What about us? What options do we have right now?
Let's go to lower time frames to gather further information.
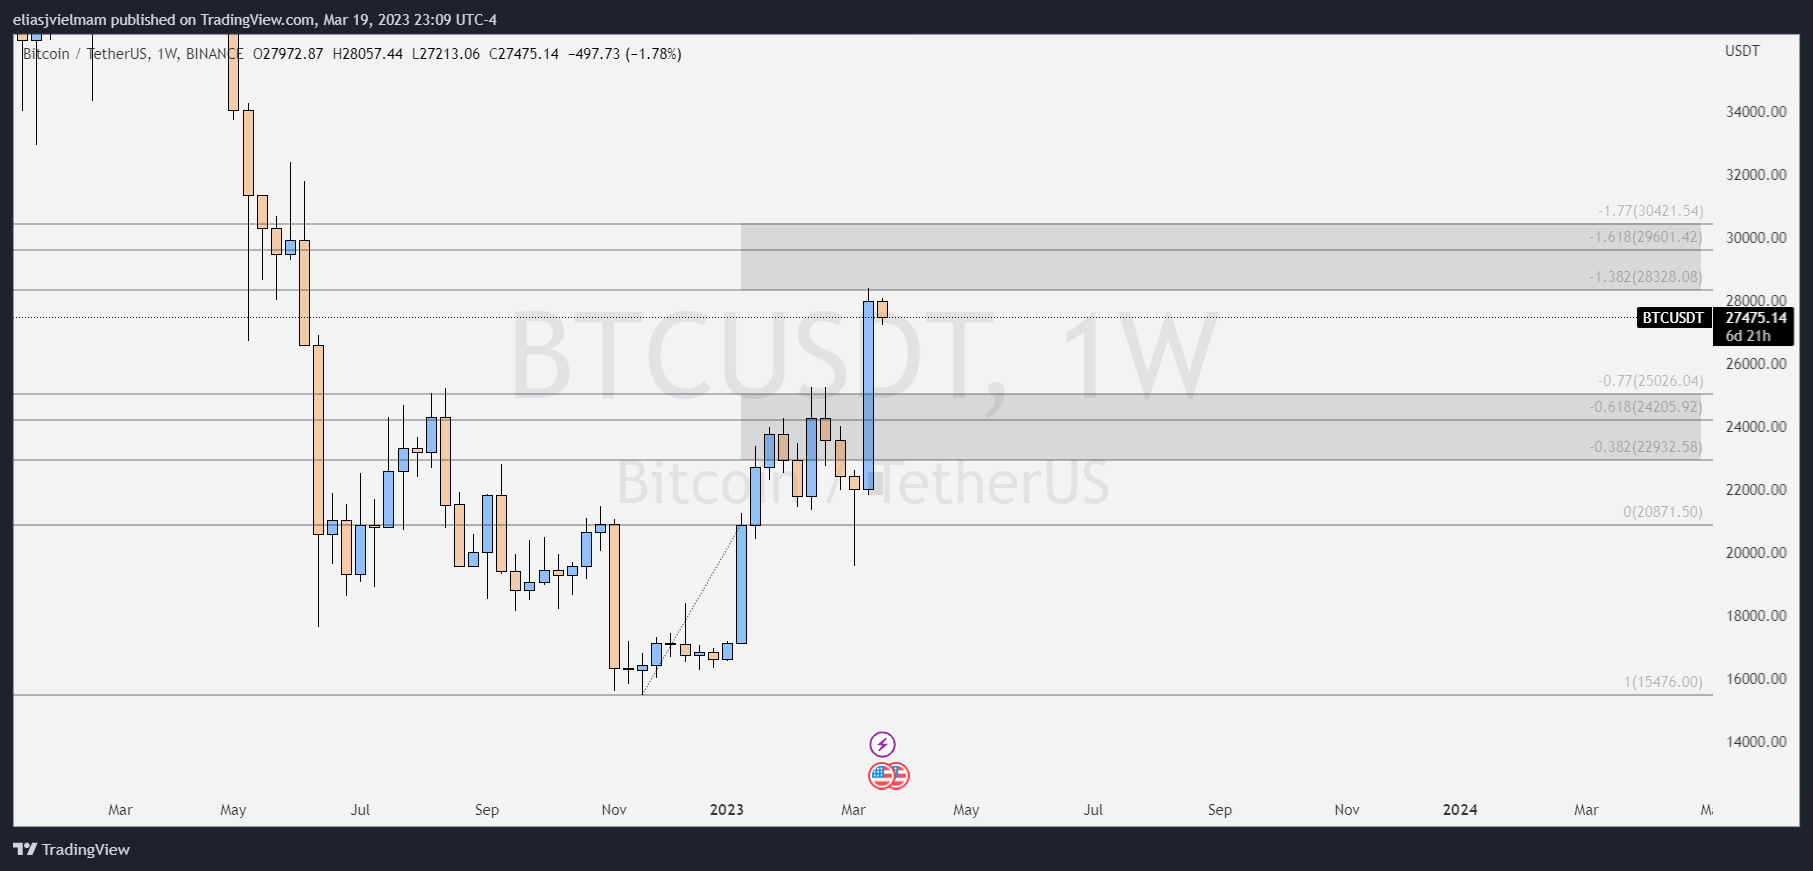
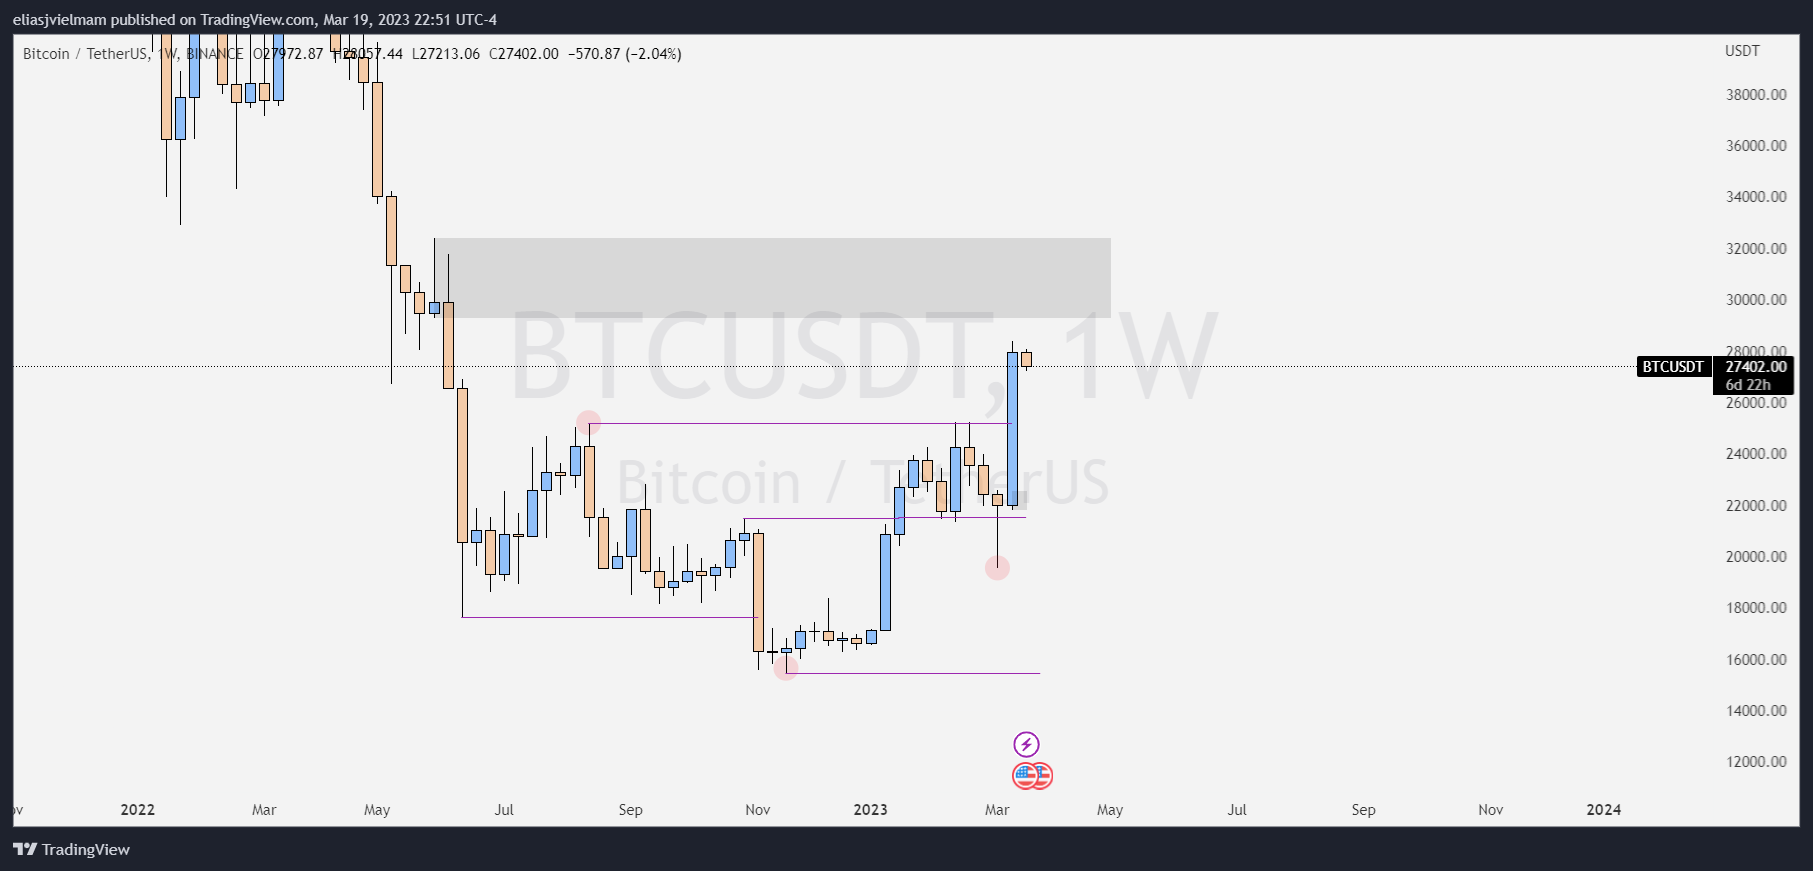
The Daily Chart
In this zoomed-out Daily Bitcoin chart we may see that we still have plenty of work to do before reaching higher grounds, and the potential OB zone.
Let's zoom-in and see the key levels in the recent price action:
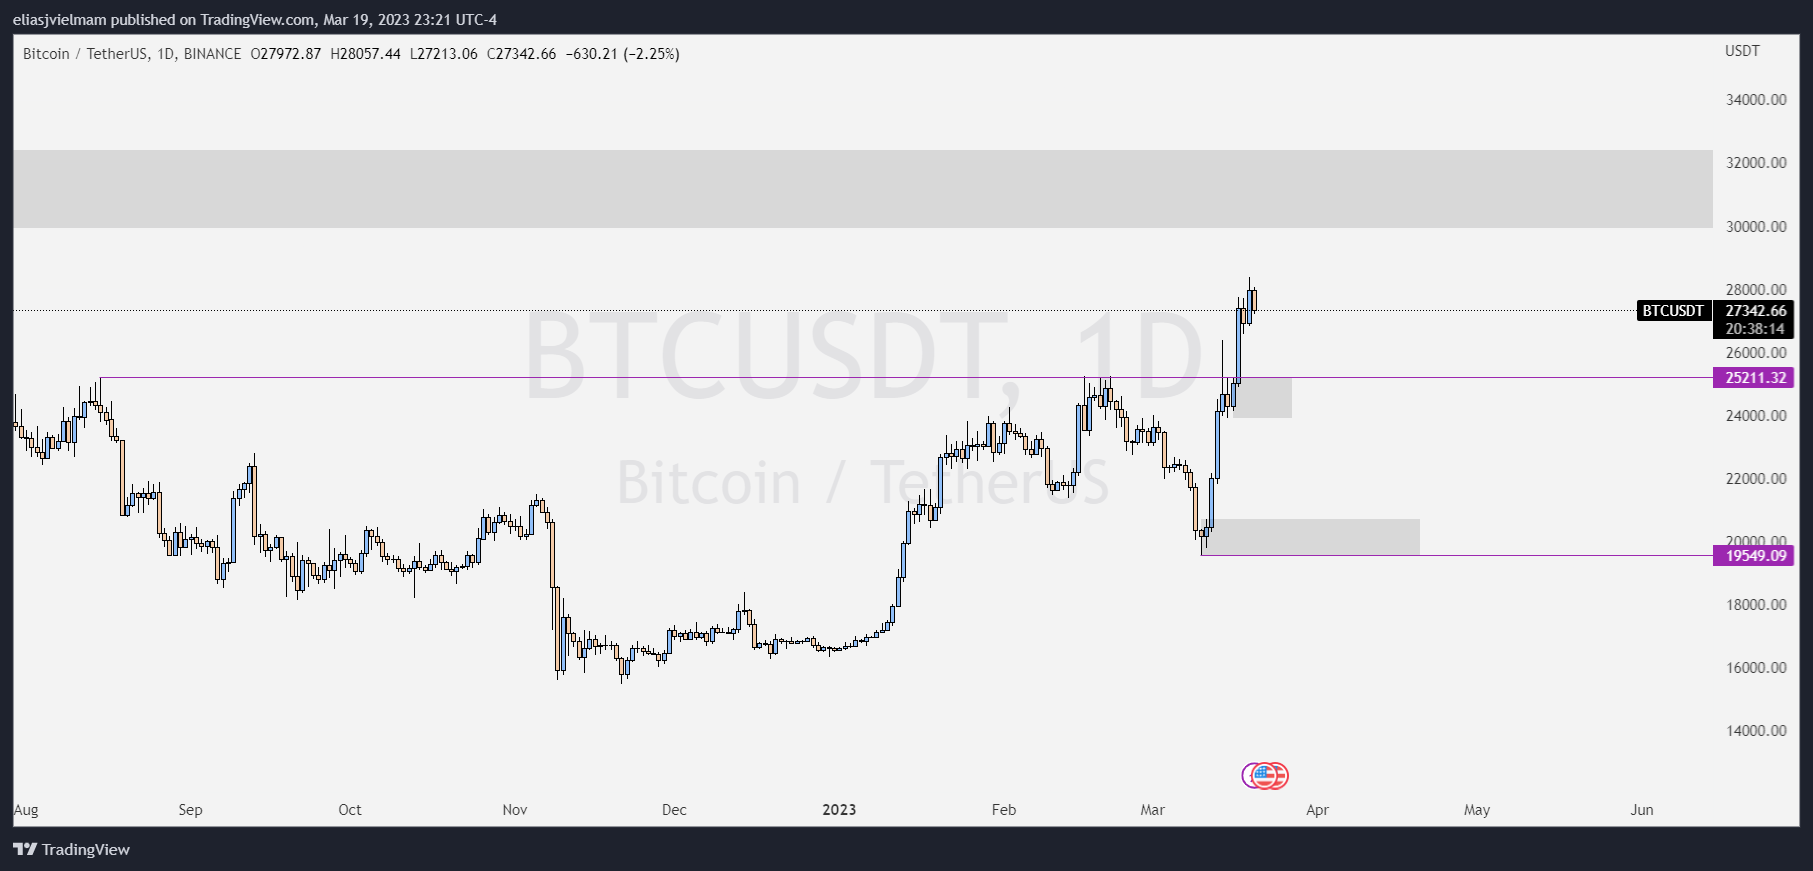
Remember the concept of Order Blocks? (a pause before the continuation of the move) - if we look closely enough, we may easily find two interesting zones:
The closer one: Between $23896.95 and $25167.40
Here we find a "pause" a.k.a. an Order Block to which the price may retrace before continuing up, OR will be strongly broken in case of going lower.
This zone will be of high interest and we will evaluate the reaction the price gives us if/when reaches this area, for a potential long.
The lower one: Between $19549.09 and $20686.51
Here was the last range in which the price found enough liquidity to develop this huge upward movement. If we happen to visit this area again, it is more likely to repeat itself, even stronger!
Final Remarks
Last week was wild!
We saw a very spiky, accelerated movement, mainly due to the collapse of the entire banking system! Just another day in paradise (:
In this sense, this week it is more likely to see a decrease in price to gather enough liquidity to continue higher.
We could also see a consolidation, this is the creation of a new range and a lateral ping-pong movement, usually very good for trading.
…or even, a lose of hype and price breaking downwards these interest zones. This being the least probable case, is not ruled out yet, as this may cause institutions to ape-in at lower prices and a full-bull cycle to start violently.
This movement upwards gave us two chances to position Long this week and we gathered more than 600% in just one week!!
Oh my... what a great week we had:
At the present time, we will evaluate the charts in a Daily basis, as well as the news, as everything I am stating here corresponds to healthy market conditions, and the world today... is not a healthy place.
This being said, the plan is as follows:
- Hope for a correction (down) from actual levels so we could position LONG in points of interest according to strategy entry rules.
- This long idea is invalidated if we continue the movement upwards and reach the OB upper area.
- If the former turns out to be truth, then we will evaluate the price action in lower time frames to search for a valid entry SHORT.
It is important to avoid panic. We as traders can profit from whatever circumstance the market can give us.
Let that sink in. Let's keep calm, and freaking trade!

SPANISH:
Divertido, verdad?
Una semana histórica, y al fin! Ganancias!
Bias Direccional
Hola a todos en las comunidades de Hive y LeoFinance!
Quería compartir con ustedes mi visión personal y plan de trading dada la última acción de precios mostrada por Bitcoin, y todas cada altcoin en consecuencia. ¡¡¡Comenzamos!!!
El Gráfico Semanal
Así que desde una perspectiva semanal podemos ver un rechazo muy claro y fuerte a la zona de rango anterior ($21480's - $25211.32) y una ruptura clara por encima de la estructura.
No suelo hacer predicciones de precio y tal... pero creo sinceramente que este impulso y ruptura de estructura marca el final del ciclo bajista... adelantándose a la fecha pautado para el proximo halving, así que esto me lleva a pensar en el próximo ATH... probablemente va a ser épico, y probablemente mucho más allá de cualquier predicción.
Pero me estoy precipitando. Volvamos a los gráficos...
Básicamente, vemos al precio atravesando con fuerza los máximos del rango anterior. En AT esto se llama Ruptura de Estructura y marca un cambio en el sentimiento del mercado. Siendo estos gráficos Semanales, no es menos que significativo al tener tanta fuerza.
Hasta ahora, la idea general es alcista.
Dadas las circunstancias la pregunta que todo el mundo se hace es "¿cuánto más va a subir el precio? o "hasta donde llegara?".
Para responder a esta pregunta voy a utilizar dos principios fundamentales de analisis tecnico:
El primero y el más sólido y fiable, y claramente visible, incluso a simple vista: El nivel de OB.
Sin entrar en una explicacion profunda y complicada, vamos ver que el movimiento bajista anterior, el que nos trajo hasta este rango inferior hizo como una "pausa" - es una pequeña vela alcista en medio del gran movimiento bajista. A esta pausa se le conoce con muchos nombres: DBD, Base o nivel OB.
Esta una zona de concentración de órdenes (ordenes Limit y ordenes Stop, asi como muchos Stop Loss), y es muy probablemente, una zona de interés institucional para vender. Una reacción a esta zona podría llevarnos de nuevo al rango anterior.
Del mismo modo, para continuar el movimiento al alza, es necesario ver una ruptura clara de esta zona.
El segundo principio es un poco mas técnico, así que sin entrar demasiado en explicarlo, me limitaré a mostrártelo. Se llama Ruptura Dominante.
Utiliza diferentes niveles matemáticos dentro de la secuencia de Fibonacci para determinar zonas de movimientos de alta probabilidad, esto debido principalmente a la naturaleza fractal de los mercados.

Si nos fijamos bien, las dos zonas fractales que nos da la Ruptura Dominante son el rango alto (que ahora es el intermedio), y la nueva zona más alta. Esto nos da confluencia con la idea de ver una reacción en la zona OB de mas arriba.
Usando estas dos sencillas técnicas obtenemos la idea principal macro-direccional:
- El precio está subiendo y tal vez la próxima semana nos de una nueva zona de rango, entre los niveles del $28300 - y el $30420 antes de decidir qué direccion va a tomar a continuación.
¿Y nosotros? ¿Qué opciones tenemos ahora mismo?
Vayamos a temporalidades más bajas para reunir más información.
El Gráfico Diario
En este gráfico lejano de Bitcoin en velas diarias podemos ver que aún nos queda mucho camino por recorrer antes de llegar a terrenos más altos, y a la zona potencial zona OB.
Hagamos zoom y veamos los niveles importantes en la acción del precio mas reciente :
¿Recuerdas el concepto de Bloque de Ordenes? (una pausa antes de la continuación del movimiento) - si miramos lo suficientemente cerca, podemos fácilmente encontrar dos zonas interesantes:
La más cercana: Entre $23896.95 y $25167.40
Aquí encontramos una "pausa", es decir, un Bloque de Ordenes hasta el cual el precio pudiera facilmente retroceder antes de continuar subiendo, O que va a necesitar romper con fuerza en caso de que quiera ir más abajo.
Esta es una zona de alto interés por lo que nosotros tranquilamente evaluaremos la reacción que tenga el precio si/cuando llegue a esta zona, para un potencial LONG.
La inferior: Entre $19549.09 y $20686.51
Aquí estuvo el último rango en el que el precio encontró liquidez suficiente para desarrollar este enorme movimiento al alza. Si volvemos a visitar esta zona, lo más probable es que se repita, ¡incluso con más fuerza!
Comentarios finales
¡La semana pasada fue salvaje!
¡Vimos un movimiento muy brutal y acelerado, principalmente debido al colapso de todo el sistema bancario! Normal, jajaja (:
En este sentido, esta semana es más probable ver una disminución en el volumen y volatilidad, y ver un retroceso en el precio para que pueda juntar suficiente liquidez para continuar más arriba.
También podríamos ver una consolidación, es decir que se forme un nuevo rango en estos niveles actuales del precio y nos de un movimiento lateral como de ping-pong, que por lo general muy bueno para el trading.
...o incluso, una pérdida de hype y rompimiento a la baja de cada una de estas zonas de interés. Esta situacion si bien es menos probable, no se descarta aún, ya que de ocurrir, pudiera provocar que las instituciones se lancen a comprar a precios más bajos y se inicie un violento y nunca antes visto ciclo alcista completo.
Este movimiento al alza nos dio un par de oportunidades de posicionarnos Largos esta semana pasada y logramos mas de 600% en tan solo una semana!!!
Madre mía... qué semana:


En este momento, vamos a evaluar los gráficos solo en su temporalidad Diaria, y el desarrollo de las noticias, ya que todo lo que aquí expongo corresponde a condiciones de mercado saludables, y el mundo de hoy... no es un lugar saludable que se diga.
Dicho esto, el plan es el siguiente:
- Esperar una corrección (a la baja) desde los niveles actuales para poder posicionarnos LARGO en puntos de interés según las reglas de entrada de la estrategia.
- Esta idea de largos queda invalidada si continuamos el movimiento al alza y alcanzamos la zona superior del OB.
- Si lo anterior se da, entonces evaluaremos la acción del precio ahora si en temporalidades menores para buscar una entrada válida en CORTO.
Es importante evitar el pánico. Nosotros, como traders, podemos beneficiarnos de cualquier circunstancia que el mercado pueda darnos.
Piensa en eso. Relajate y vamos a tradear!
Posted Using LeoFinance Beta
Yeah, was an amazing BTC week! 📈🚀
In my view we could well run towards 35-40k before we see a bigger consolidation.
Awesome.
What drives the price in any market is the laws of Supply and Demand.
When you think of a grocery product or physical asset, it is easy to picture: no more apples, then apples get more expensive. Too expensive apples, nobody buys and it starts to decompose, so it gets cheaper.
When we translate this into charts, we will always need to find points of imbalance. What this means is points where the price is sufficiently cheap for algorithms to ape in and buy the asset, and vice versa.
This means that we need to go down, in order to get higher.
Inversely, we need more expensive prices, so we visit cheaper zones in the future.
I see that this concept is counter-intuitive, and I'll probably have to develop in a post. Hope I didn't confuse you 😅
!PIZZA !HBIT
Posted Using LeoFinance Beta
All fine. ✌🏻
https://twitter.com/1366686073250865153/status/1637671209801330688
The rewards earned on this comment will go directly to the people( @elyelma ) sharing the post on Twitter as long as they are registered with @poshtoken. Sign up at https://hiveposh.com.
PIZZA Holders sent $PIZZA tips in this post's comments:
@elyelma(1/5) tipped @borsengelaber (x1)
You can now send $PIZZA tips in Discord via tip.cc!