2 Jahre Wikifolio Fintwit Select - 2 years Wikifolio Fintwit Select
Rückblick, Performance, Analyse:
english see below
Vor etwas mehr als 2 Jahren, am 19.03.2022, habe ich das Dach-Wikifolio neu angelegt.
Zeit also für einen Rückblick wie es sich entwickelt hat.
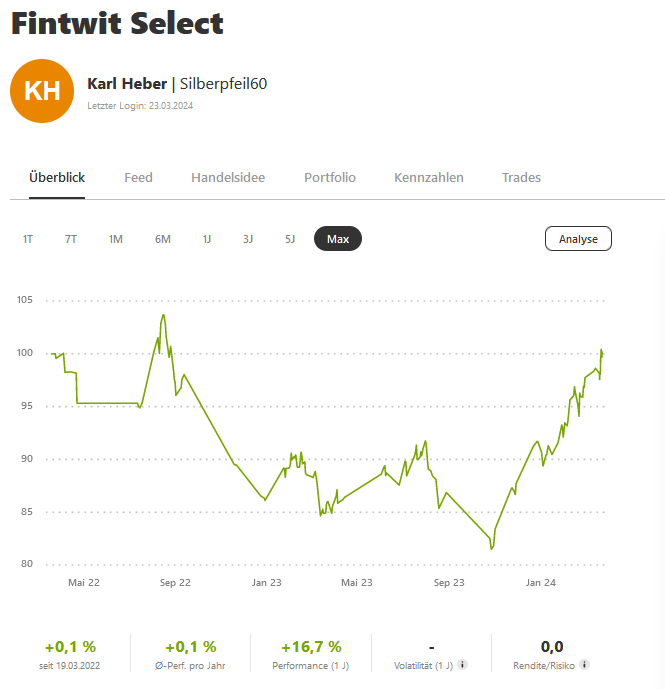
Das Wikifolio steht fast wieder genau auf dem Stand wie vor 2 Jahren, aktuell bei 100,11.
Ausser Spesen nichts gewesen? Klar könnte man so sagen.
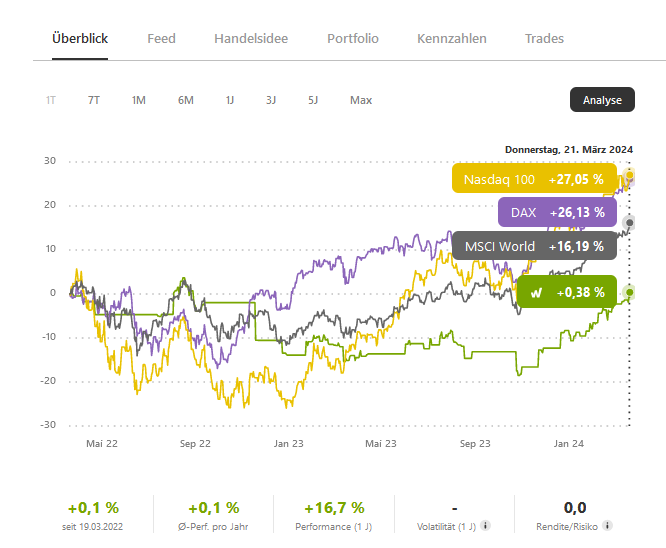
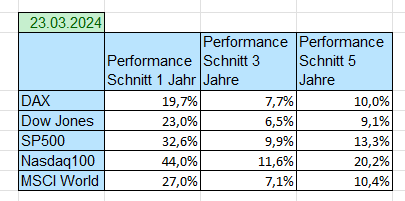
Im Vergleich zu den bekannten Indizes wie DAX, MSCI World oder Nasdaq100 sieht es noch schlechter aus. Und wenn man dann noch die Inflation dazu rechnet, hätte man real Geld verloren.
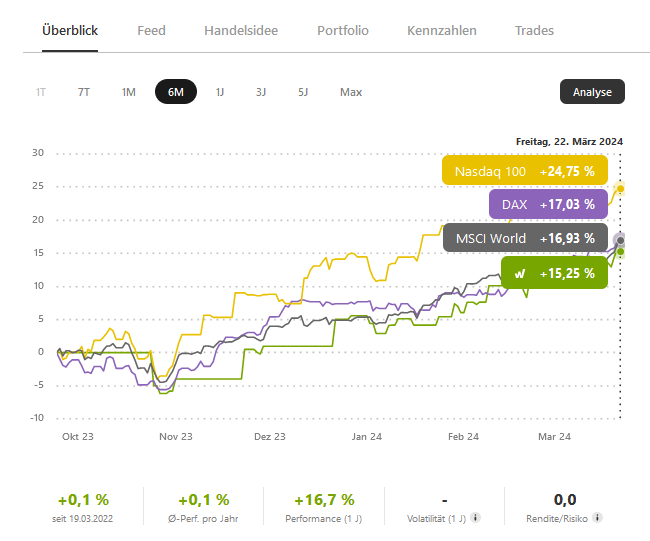
Schaut man sich die letzten 6 Monate an, dann sieht die Performance nicht mehr ganz so schlecht aus.
Warum hat sich das Wikifolio die ersten 18 Monate so schlecht entwickelt? Im 1. Jahr war die Performance im Vergleich zum Nasdaq sogar besser. Dann aber legten die Indizes kräftig zu, vor allem der Nasdaq. Diesen Aufwärtstrend konnte das Wikifolio nicht bzw. erst in den letzten Monaten mitmachen, bzw. nachholen.
Warum ist das aber so? Anfangs war angedacht, alle darin enthaltenen Wikifolio gleich zu gewichten. Das führte aber dazu, dass sich schlecht entwickelnde Positionen einen stärkeren Einfluß auf die Gesamtperformance hatten. In den letzten Monaten bin ich dazu übergegangen, die gut laufenden Positionen aufzustocken. Hier wird nachgekauft und zur Absicherung der StopLoss nachgezogen. Dadurch erhalten diese Positionen ein höheres Gewicht und dies zeigt sich auch in der besseren Entwicklung des gesamten Wikifolio in den letzten Monaten.
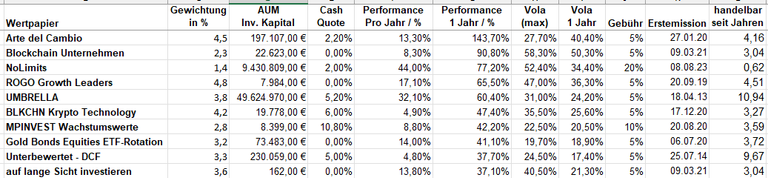
Und wie sieht nun aktuell die Gewichtung aus?
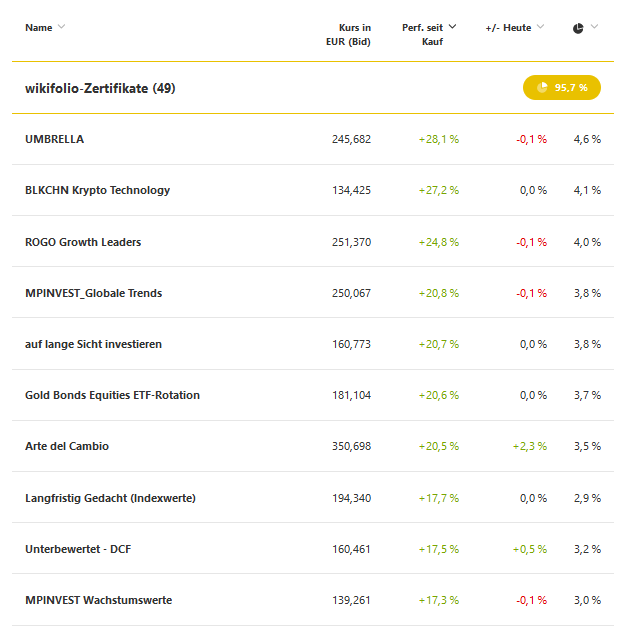
Die Top Ten sind mit 3,0% bis momentan 4,6% im Wikifolio vertreten.
Wo es Gewinner gibt, gibt es auch Verlierer:
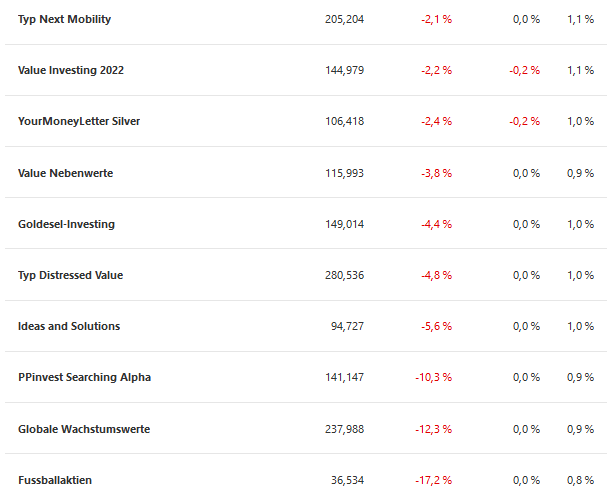
Am unteren Ende ist die Gewichtung inzwischen auf 0,8% - 1,1% zurück gefahren worden.
Die Idee für das Wikifolio war ja, verschiedene Wikifolio und Strategien zu vergleichen.
Wenn wir uns die Top-Performer anschauen, dann profitieren diese zum Teil von den starken Entwicklungen im Bereich Krypto, Technologie und AI/KI bzw von den Investionen in Rüstung.
Umbrella:
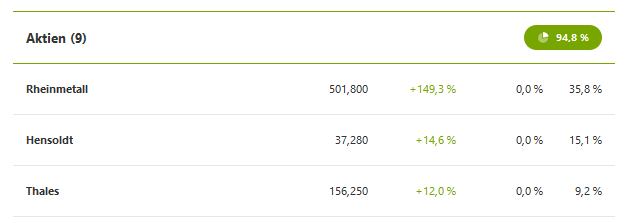
Umbrella ist mit mehr als 50% sehr stark in Rüstung (Rheinmetall und Hensoldt) investiert. Im Moment sind 9 Aktien enthalten und die Cashquote liegt bei 5%.
BLKCHN Krypto Technology
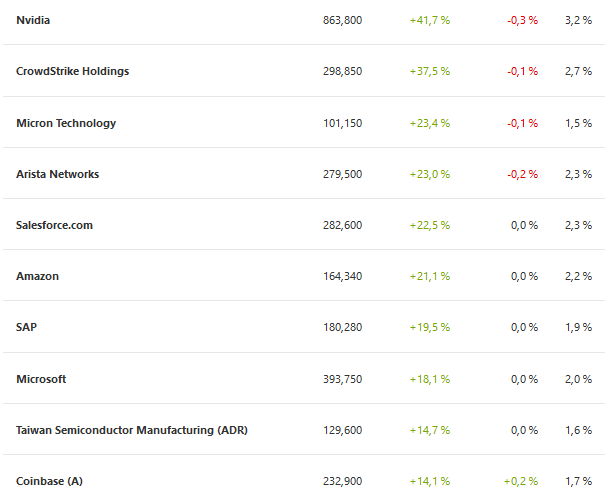
Hier zeigt sich eine breitere Streuung. Bei den Aktien dominieren Technologie, Halbleiter und Software. Bei den ETF ist Crypto stark vertreten. Bei den Optionsscheinen dominieren ebenfalls die Scheine auf Software-Aktien.
Die 2 größten Einzelpositionen mit je 4% sind 2x gehebelte ETF auf Nasdaq100 und SP500. Die Cashquote liegt hier bei 6%.
ROGO Growth Leaders
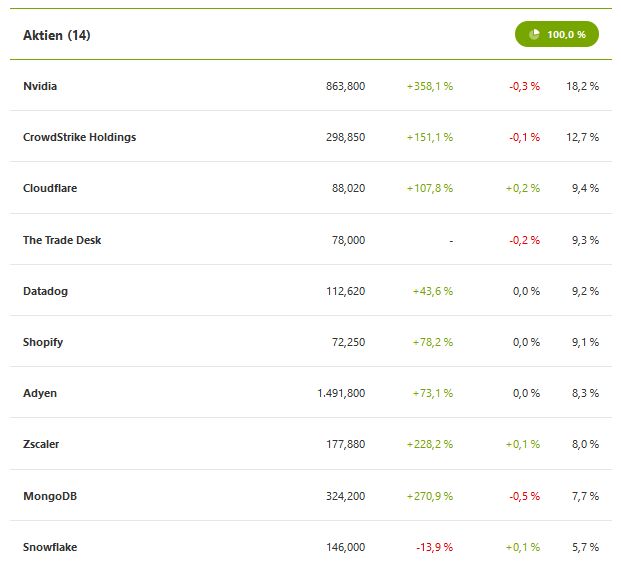
Hier dominieren ebenfalls die Software-Aktien. Das Wikifolio ist mit insgesamt 14 Positionen voll investiert (Cash 0%).
Die Positionen mit schlechterer Performance sind stark in Nebenwerten investiert. Diese haben den Aufwärtstrend an den Börsen oft noch nicht nachvollzogen.
Globale Wachstumswerte
Das Wikifolio ist mit fast 50% in Tesla investiert. Hier sind zwar ordentliche Buchgewinne aufgelaufen, aber da Tesla aktuell eher schlecht läuft schlägt sich das natürlich auch auf die Performance des Wikofolio nieder.
Fussballaktien:
Das Wikifolio ist mit über 90% im BVB investiert, wobei fast 40% in Optionsscheinen stecken. Da die Borussia aus Dortmund auf dem Fußballplatz den Erwartungen hinterher hinkt, entwickelt sich die Aktie und die OS auch eher schlecht.
Strategien
Die enthaltenen 49 Wikifolio verfolgen teilweise ganz unterschiedliche Strategien. Einige konzentrieren sich auf wenige Aktien, andere sind breit gestreut. Und natürlich unterscheiden sie sich auch in den Anlageschwerpunkten.
Performance Indizes
Min, max und Durchschnitt
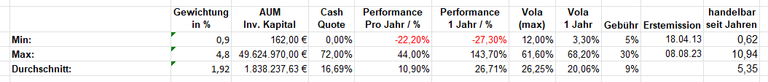
Bei den verschiedenen Kriterien zeigen sich große Unterschiede.
Beim AUM reicht die Spanne von knapp 50 Millionen bis gerade einmal 160 €.
Das am längsten aktive und handelbare Wikofolio existiert schon seit mehr als 10 Jahren, das neueste erst sei gut einem halben Jahr.
Die durchschnittliche Performance pro Jahr schwankt zwischen -22% und +44%.
Die Performance mit Blick auf ein Jahr reicht von -27% bis +143%.
Und auch bei der Volatilität gibt es große Unterschiede: von 3,3% bis 68%.
Top Positionen nach AUM:
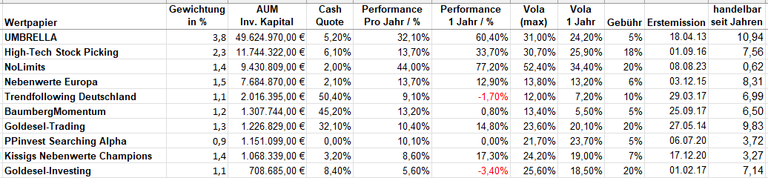
Insgesamt sind in den getrackten Wikifolio ca 90 Millionen € investiert.
Top Ten durchschnittliche Performance
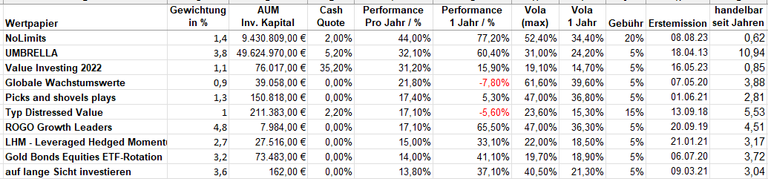
Top Ten Performance 1 Jahr
Jetzt wünsche ich allen erstmal ein schönes Wochenende und dann weiter gute Trades.
2 Jahre Fintwit Select Wikifolio Rückblick, Performance und Strategie.
Weitere Blog-Artikel zum Wikifolio Fintwit Select Performance
Looking back, performance, analysis:
Just over 2 years ago, on 19.03.2022, I created the Dach-wikifolio. So it's time for a review of how it has developed.
The wikifolio is almost back to exactly where it was 2 years ago, currently at 100.11. Nothing gained except expenses? Sure, you could say that.
Compared to well-known indices like the DAX, MSCI World, or Nasdaq100, it looks even worse. And if you factor in inflation, you would have actually lost money in real terms.
Looking at the last 6 months, the performance doesn't look quite as bad anymore.
Why did the wikifolio perform so poorly in the first 18 months? In the first year, the performance was even better compared to the Nasdaq. But then the indices rose sharply, especially the Nasdaq. The wikifolio could not or only catch up with this upward trend in the last few months.
But why is that? Initially, the idea was to weight all the wikifolio included equally. However, this led to poorly performing positions having a stronger impact on the overall performance. In recent months, I have started to increase positions that are performing well. Here, additional purchases are made and the stop loss is adjusted for hedging. As a result, these positions receive a higher weight, which is also reflected in the better performance of the entire wikifolio in recent months.
And what is the current weighting now?
The top ten are represented in the wikifolio with 3.0% to currently 4.6%.
Where there are winners, there are also losers:
At the bottom, the weighting has now been reduced to 0.8% - 1.1%.
The idea for the wikifolio was to compare different wikifolio and strategies.
If we look at the top performers, they benefit partly from strong developments in the crypto, technology, and AI sectors, or from investments in defense.
Umbrella:
Umbrella is heavily invested in defense (Rheinmetall and Hensoldt) with more than 50%. At the moment, there are 9 stocks included and the cash position is 5%.
BLKCHN Crypto Technology:
Here we see a broader diversification. Technology, semiconductors, and software dominate the stocks. Crypto is strongly represented in the ETFs. The options are also dominate in software stocks. The two largest individual positions, each with 4%, are 2x leveraged ETFs on Nasdaq100 and SP500. The cash position here is 6%.
ROGO Growth Leaders:
Software stocks also dominate here. The wikifolio is fully invested with a total of 14 positions (cash 0%).
The positions with poorer performance are heavily invested in small caps. These have often not yet followed the upward trend in the markets.
Globale Wachstumswerte
The wikifolio is almost 50% invested in Tesla. While there have been decent gains, since Tesla is currently performing poorly, this naturally also affects the performance of the wikifolio.
Fussballaktien:
The wikifolio is over 90% invested in BVB, with almost 40% in options. Since Borussia Dortmund is lagging behind expectations on the football field, the stock and options are also performing poorly.
Strategies:
The 49 wikifolio included follow partly very different strategies. Some focus on a few stocks, while others are more diversified. And of course they also differ in their investment priorities.
Performance indices:
Min, max and average
When it comes to various criteria, there are large differences. The AUM range from just under 50 million to just 160 €. The longest active and tradable wikifolio has been around for more than 10 years, while the newest one has only been around for half a year. The average annual performance fluctuates between -22% and +44%. The performance over a year ranges from -27% to +143%. And there are also large differences in volatility: from 3.3% to 68%.
Top positions by AUM:
In total, around 90 million € is invested in the tracked wikifolio.
Top ten average performance:
Top ten performance 1 year:
More posts to Wikifolio Fintwit Select Performance
Now I wish everyone a nice weekend and then continue with good trades.

Congratulations @blkchn! You have completed the following achievement on the Hive blockchain And have been rewarded with New badge(s)
Your next payout target is 100 HP.
The unit is Hive Power equivalent because post and comment rewards can be split into HP and HBD
You can view your badges on your board and compare yourself to others in the Ranking
If you no longer want to receive notifications, reply to this comment with the word
STOP