The Hurst Cycle – Forecasting Market Rhythm with Time Waves (Part 7 in Series)
Markets feel chaotic. Stocks go up, crash, recover, stall—sometimes all in a week. But what if there was a rhythm underneath all that noise?
That’s what the Hurst Cycle attempts to uncover.
Welcome to Part 7 in our cycle series. If you’re just tuning in, you can start with Part 1 here for the full map of the seven cycles smart investors are watching.
📊 Who Was Hurst?
J.M. Hurst was a NASA engineer-turned-market analyst back in the 1960s and ’70s. He noticed something strange while looking at price data—markets move in time-based waves. Not just price trends, but cycles that repeat in consistent intervals, regardless of fundamentals.
He developed tools to isolate these cycles, combining math, pattern recognition, and a bit of intuition to build what he called “profit magic”—a method to predict market turning points using cycle analysis.
🌀 How Hurst Cycles Work
The idea is that multiple overlapping cycles—each with their own wavelength—combine to create the price action we see. Kind of like ocean waves stacking and canceling each other out.
Here’s how Hurst’s cycle model breaks down:
- Short cycles: 10–20 day waves (trader timing)
- Medium cycles: 40–80 day swings (investor setups)
- Long cycles: 18-month, 4-year, even 9-year waves (big picture trends)
By using tools like sine wave projections, spectral analysis, and centered moving averages, Hurst analysts aim to time tops and bottoms with uncanny accuracy.
🧠 Why It Matters for Investors
This isn’t astrology—it’s pattern recognition based on time. If multiple cycles are converging on a trough, that might be the moment to buy the dip. If they’re topping together, maybe it’s time to take profits or hedge your positions.
Hurst cycles are especially useful for swing traders, but long-term investors can benefit too—especially when a multi-year cycle is about to flip.
📊 Chart for Reference
Here’s a visual example of Hurst cycle analysis in action:
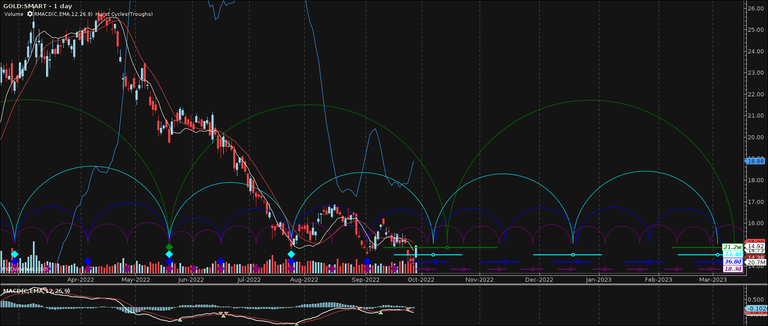
![Hurst Cycles Visual]
Source: Seeking Alpha / Sentient Trader
💬 Final Thoughts
The Hurst Cycle might not be as well-known as the debt cycle or real estate booms, but it’s one of the most practical tools for timing entries and exits. If you believe that markets have memory—and they do—then cycle analysis just gives you a better read on when the next tide’s about to turn.
📚 Next Up: In the final installment (Part 8), we’ll wrap it all up with a summary of how to layer these cycles together in real-world investing.
✍️ Stay Connected with Grandpa Pulse
![]()
Crypto hustler • Market cycles explorer • Faith & finance from a front-porch philosopher
📲 Follow me on social:
🐦 X (Twitter)
💬 Blurt.blog
📺 YouTube
Meta Description:
Hurst Cycles help traders spot market turning points by analyzing repeating time-based waves hidden in price movements.
Posted Using INLEO