Splinterlands 🐉| Essential Websites & Tools for Every Player!
Splinterlands is one of the few crypto games with a large number of tools that assist players, providing a wealth of useful information. Since the theme of the Splinterlands Community Engagement Challenge is "Teach & Triumph," focused on sharing experiences and information aimed at helping new players, but also experienced players, I believe discussing these tools is a great topic that ties in perfectly with this week's theme.
Therefore, we will cover two of the main websites that are essential for players to keep up with the game's progress, focusing on the most interesting tools available. The first will be Peakmonsters, where we will focus on their Dashboard tool, while the second will be SplinterCards, which has a home page with a lot of interesting information about the game's tokens. #splinterlands #communitychallenge #teachandtriumph
I'll be much appreaciated if you Upvote, Reblogs or give any Tips ( PIZZA 🍕, PGM 🎮, LOLZ 😆, ALIVE ❤️, etc ). Thanks and have good reading! 🍀

[ENGLISH VERSION]
Peakmonsters Dashboard
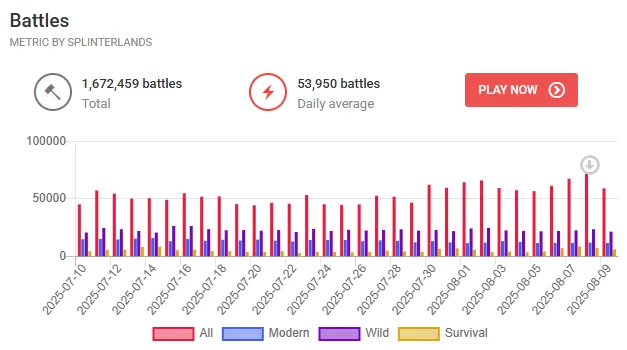
I chose the Peakmonsters Dashboard as the first tool/website to share with other Splinterlands players because in my last post about Splinterlands, I discussed in detail one of the pieces of information the Dashboard presents: the number of battles metric. Using the battle graph data alone, the player can track whether there are more or fewer battles, which indicates the overall activity within Splinterlands. They can also explore which mode has seen the most battles: Modern Format, Wild Format, or Survival Mode.
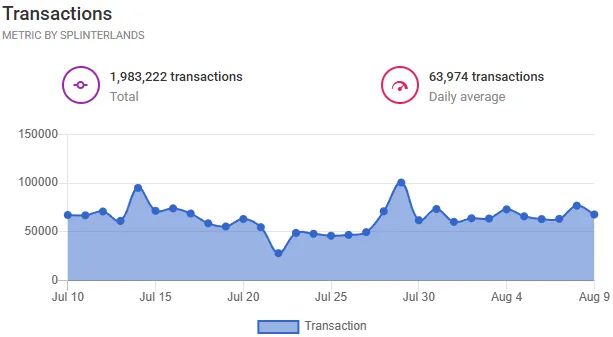
The amount of information that can be extracted from just a single dataset is truly impressive. In Peakmonsters Dashboards, there are a total of eight datasets that are aggregated into line or column charts. The battle metric has already been discussed, but another metric I like to monitor to get a sense of activity within Splinterlands is the daily transactions metric, because it provides a more comprehensive understanding of player interactions with the entire game ecosystem.
For example, if the number of matches played on a given day is low but the number of transactions is high, it indicates that users are engaging in other in-game activities unrelated to ranked matches. An example worth exploring further is why on July 29th there were 100,000 transactions, while the daily average is 63,000, while the number of matches played was below normal, at only 46,000.
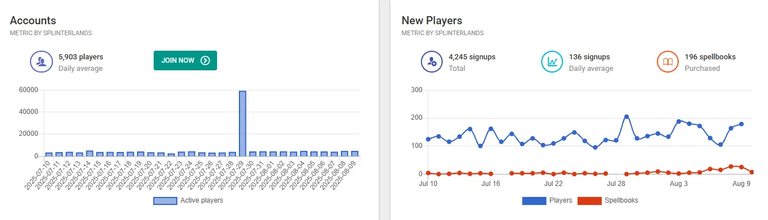
Other interesting graphs include the number of daily active players, which, according to the graph above, has been close to 6,000 users daily. On the 29th, there was a peak of almost 60,000, possibly due to a game update. Another related figure is the number of new players, which shows how many people created a Splinterlands account and how many of them ended up purchasing the Spellbook. Both help identify activity within Splinterlands, whether players are more or less active, and whether more users are arriving.
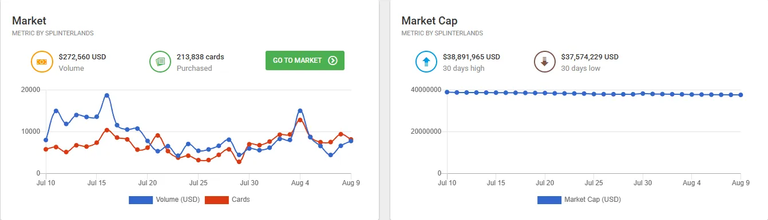
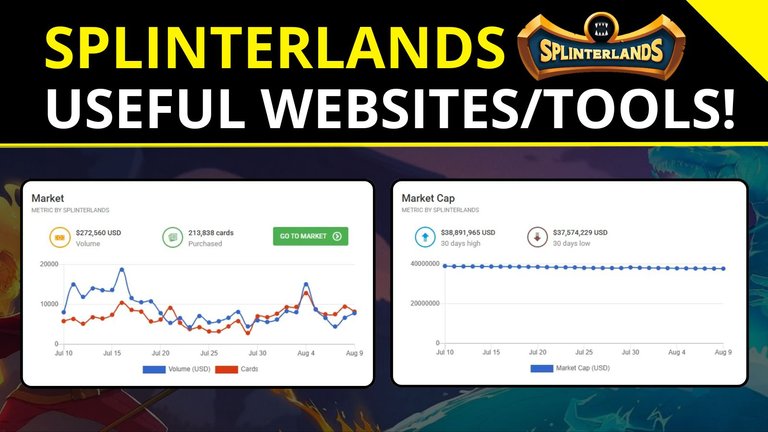
Next, we have the graph showing the Splinterlands Market Cap, where players can see whether it's rising or falling over the days. But the best data is the data regarding the game's Marketplace, which indicates the volume in dollars and the number of cards traded each day. We can see that at the beginning of last month there was a very high trading volume, even with few cards being traded. Then, this volume began to decline, until in the last few days we see a greater number of cards being traded, but with a lower volume.
Splintercards - Token Prices
We also have two other graphs that show the progress of the tokens, but to monitor the price evolution of both Splinterlands tokens and other cryptocurrencies that may ultimately impact the crypto game as a whole, I prefer to analyze the Splintercards homepage.
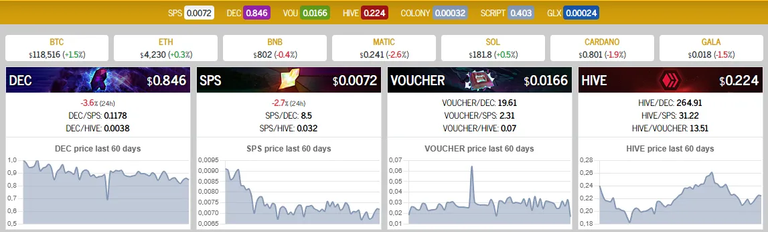
Without even scrolling, players can get a general idea of the Splinterlands tokens' current status: 1000x DEC = $0.84; SPS = $0.007; Voucher $0.016. Not only that, they can also check the prices of major cryptocurrencies: BTC = $118,000; Ethereum = 4,000. It's a great site that gathers all the information players need when it comes to token prices.
Splinterlands é um dos poucos crypto games com um grande número de ferramentas que auxiliam o jogador, com diversas informações úteis. Assim, como o tema do Splinterlands Community Engagement Challenge é “Teach & Triumph”, ou seja, voltado à compartilhar experiências e informações que visam ajudar novos jogadores, mas tem jogadores experientes, acredito que falar sobre essas ferramentas seja um ótimo ponto que tem tudo haver com o tema dessa semana.
Dessa forma, iremos abordar dois dos principais sites que são fundamentais para o jogador acompanhar como anda o jogo, focando nas ferramentas mais interessantes de cada um deles. O primeiro será o Peakmonsters, onde focaremos na ferramenta de Dashboard que eles possuem, enquanto o segundo será o SplinterCards, que tem uma página inicial com diversas informações interessantes sobre os tokens do jogo. #splinterlands #communitychallenge #teachandtriumph
Fico agradecido se você puder dar um Upvote, Reblogs ou algum Tips ( PIZZA 🍕, PGM 🎮, LOLZ 😆, ALIVE ❤️, etc ). Obrigado e boa leitura! 🍀
[VERSÃO PORTUGUÊS]
Peakmonsters Dashboard
Escolhi como a primeira ferramenta/site à compartilhar com os demais jogadores de Splinterlands o Peakmonsters Dashboard, porque no último post sobre Splinterlands, abordei em detalhes uma das informações que o Dashboard apresenta, que é com relação à métrica de número de batalhas. Apenas com dos dados do gráfico de batalha o jogador consegue acompanhar se está havendo mais ou menos batalhas, o que indica a atividade geral dentro do Splinterlands e ainda explorar de qual modo tem vindo a maior quantidade de batalhas, se é do Modern Format, Wild Format ou do Survival Mode.
É realmente muito interessante a quantidade de informação que pode ser extraída de apenas um único conjunto de dados. No Peakmonsters Dashboards, existe um total de 8 conjuntos de dados que são agregados em gráficos de linhas ou de colunas. O de batalhas já foi apresentado, mas outro que eu gosto de observar para ter uma noção da atividade dentro do Splinterlands é a métrica de transações realizadas no dia, porque dá para ter uma noção mais macro de interações dos jogadores com todo o ecossistema do jogo.
Por exemplo, se o número de partidas no dia for baixo, mas a quantidade de transações for alta, indica que os usuários estão realizando outra atividade dentro do jogo que não tem relação com as partidas Ranked. Um exemplo que pode ser explorado mais afundo é porque no dia 29 de Julho houveram 100 mil transações, enquanto a média diária é de 63 mil, enquanto o número de partidas foi abaixo do normal, com apenas 46 mil.
Outros gráficos interessantes são o de número de jogadores ativos no dia, que tem sido de acordo com o gráfico acima, próximo de 6000 usuários todos os dias, sendo que no dia 29 houve um pico de quase 60k, sendo possivelmente alguma atualização do jogo. Outro dado relacionado é o número de novos jogadores, que mostra quantas pessoas fizeram uma conta no Splinterlands e quantas delas acabaram fazendo a compra do Spellbook. Ambos ajudam a identificar a atividade dentro do Splinterlands, se os jogadores estão mais ou menos ativos e se mais usuários estão chegando.
Em seguida, temos o gráfico que mostra o Market Cap do Splinterlands, onde o jogador pode acompanhar se vem subindo ou caindo ao longo dos dias. Mas o melhor são os dados com relação ao Marketplace do jogo, que indica o volume em dólares e o número de cartas que foram negociadas em cada um dos dias. Podemos observar que no início do mês passado havia um volume muito grande de negociação, mesmo com poucas cartas sendo negociadas. Em seguida essa quantidade começou a cair, até que nos últimos dias vemos uma quantidade maior de cartas sendo negociadas, mas com um volume menor.
Splintercards - Token Prices
Ainda temos outros dois gráficos que mostram o andamento dos tokens, mas para acompanhar a evolução do preço dos tokens tanto do Splinterlands, como de outras Cryptomoedas que podem acabar impacto o crypto game no geral, eu prefiro analisar a página principal do Splintercards.
Nela o jogador sem nem precisar fazer scrolls com o mouse consegue ter uma ideia geral de como estão os tokens do Splinterlands: 1000x DEC = $0,84; SPS = $0,007; Voucher $0,016. Mas não só isso, consegue conferir o preço das principais Cryptos: BTC = $118k; Ehereum 4k. É um ótimo site que reúne todas as informações que o jogador precisa quando o assunto é o preço dos tokens.


I love peakmonsters site and use it almost every day..
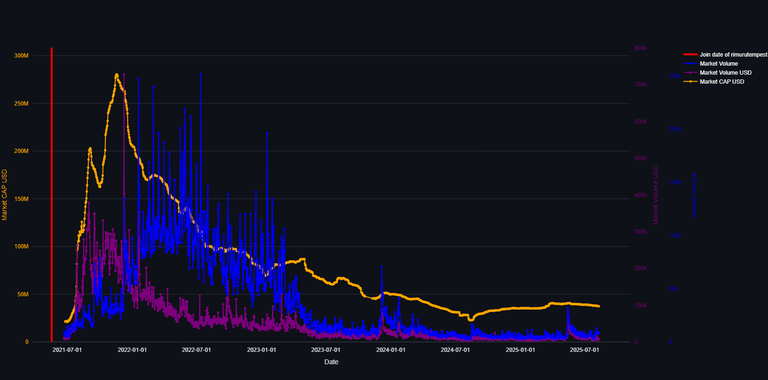
if you want a bit more history you can also view some of the data here:
https://beebalanced.streamlit.app/spl_metrics_page
Note you can also see when someone has registered (just for fun)
Wow. That's amazing, thanks for sharing.
Delegate your Hive Power to Ecency and earn
100% daily curation rewards in $Hive!
[@PowerPaul:]
Hey! Because of your participation in the @CryptoCompany community and your participation in the "Banner for Boost" campaign you received a vote from your CryptoCompany and its trail! Thank you & Hive a great day!
Recent posting from @PowerPaul or the CryptoCompany network:
by @cryptocompany
by @powerpaul
by @cryptocompany
thanks
Thanks for sharing! - @underlock
