AskLeo: Would You Find Useful an Interface That Shows the APR Evolution in Time?
First of all, is there such an interface/dapp? I can't think of any.
This just came to mind as I wondered how the relative APRs fluctuated for staked SPS in-game and various diesel pools where SPS is one of the tokens since the GLX airdrop started (and before).
It's not as easy to show a chart of the evolution of the APR for a token as to display its current value.
For the current APR, a simple (or not that simple sometimes) calculation should do it.
For the chart, you need either these details stored in a database for the charted period and then make calculations at every step, or keep the historical APR in the database or have a way to retrieve these details (like from the blockchain) and make calculations for the entire period.
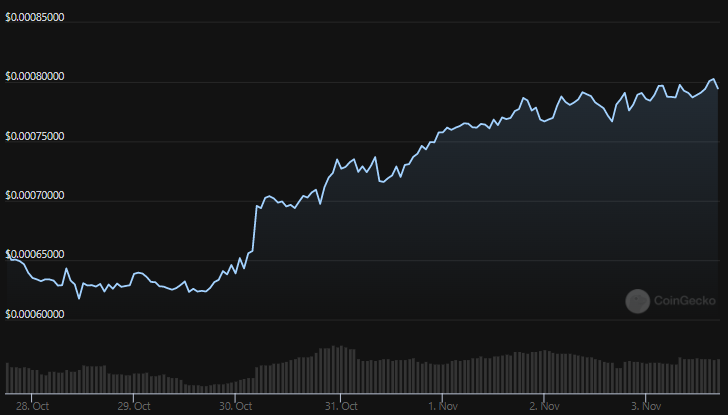
The chart of DEC, without any relation to APRs, just as a visual example.
Keeping historical APRs is the simplest, but it doesn't offer details on how calculations were made (for example, if it seems an APR is wrong and you need to double-check the numbers).
In the blockchain world, I suppose the latter option is the best because you don't need a separate database to keep these details if they are all on the blockchain (but only if they are all on the blockchain).
Why would one need a chart with the APRs?
For different reasons. I'm not going mainstream financial services with this, although it's applicable there too.
In the defi world, unless the inflation associated with a liquidity pool is modified, a change in the APR shows the liquidity level in that pool changed, and the competition lowered (if APR grew) or increased (if APR reduced) for the same inflation. Meaning more funds were withdrawn or added.
If you are in multiple such LPs and you don't track their APR levels regularly, you will miss these evolutions. A chart makes it easier to see.
Then, as I mentioned at the beginning, there are cases when certain events influence the trend of APRs over a certain period of time. In Splinterlands' case and its pools and the staking rewards APRs, this could be very useful.
Do you think APR evolution charts for a certain period would be useful for staking rewards/liquidity pool rewards/why not for dividends?
Posted Using LeoFinance Beta
It would be nice to see but I don't think the ones for tokens are that important. As for dividend APR, I think a lot of the tokens make regular posts so there is a way to see the changes over time. After all, prices change all the time so the APR can also.
Posted Using LeoFinance Beta
Not for tokens, unless they pay out a dividend. What would be more interesting is the chart for APR on staking or LP rewards I think.
Splinterlands is rich.
They can afford to pay a dev ;)
Posted Using LeoFinance Beta
No! They need to come out with that land. No more distractions for them. :)
Hi, @gadrian. Thank you for the helpful information.
Ah yes, compounding interest. Thanks for the link to APRs or Annual Percentage Return 😊
Have a great day and evening.
Barb
#thriveonhive
Posted Using LeoFinance Beta
These links for Leoglossary or Splinterglossary definitions are useful, aren't they? :)
Thanks for the great information. It will be helpful.
Posted Using LeoFinance Beta