BITCOIN ANALYSIS, 2023 Week 13th [EN/ES]
An expected range...
Three Zones, and a Hidden One.
Directional Bias
Hello everybody from Hive and LeoFinance communities! This weekend I decided to enjoy a free time and took myself and @arkpb to the beach! We had an awesome day (Liketu photos are pending) so the Weekly, Daily, and directional bias analysis are coming a bit late into this week, but it's completely fine. It won't change the main trading ideas we have for BTC.
We have seen a very strong range, as expected. Let's take a look at it right now. Let's go!!
The Weekly Chart
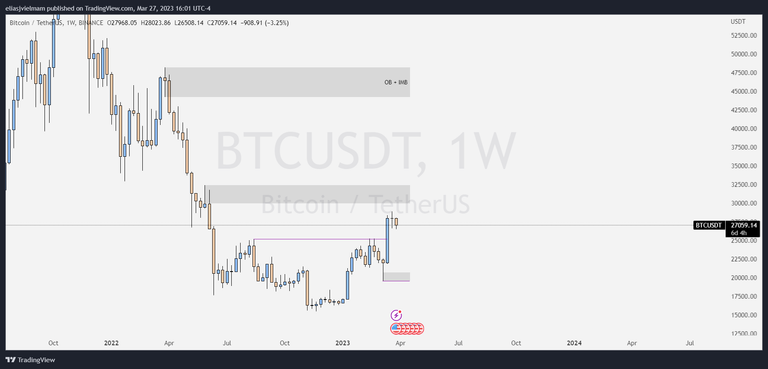
As I told you before (you can check it out here) it was very much possible to have a range (a lateral movement) before moving upwards, or downwards, as both movement are possible.
What we weren't expecting was to have such an extreme range! The Weekly candle have Open and Close value just $4 away from each other!
(The week opened at $27972.87 and closed at $27968.05)
So from a Weekly perspective, we can now have a movement both sided:
If we see an impulse to the higher OB zone, then we would be ready to find a SHORT opportunity.
However, if we see the former movement and a breakthrough of the OB zone then... wow... we could go even higher.
If we see a retracement back to lower zones, then we would get a bunch more using DCA strategy (Dollar-Cost Average) applied in specific zones, and find opportunities to open a LONG in Futures while also buying Spot BTC.
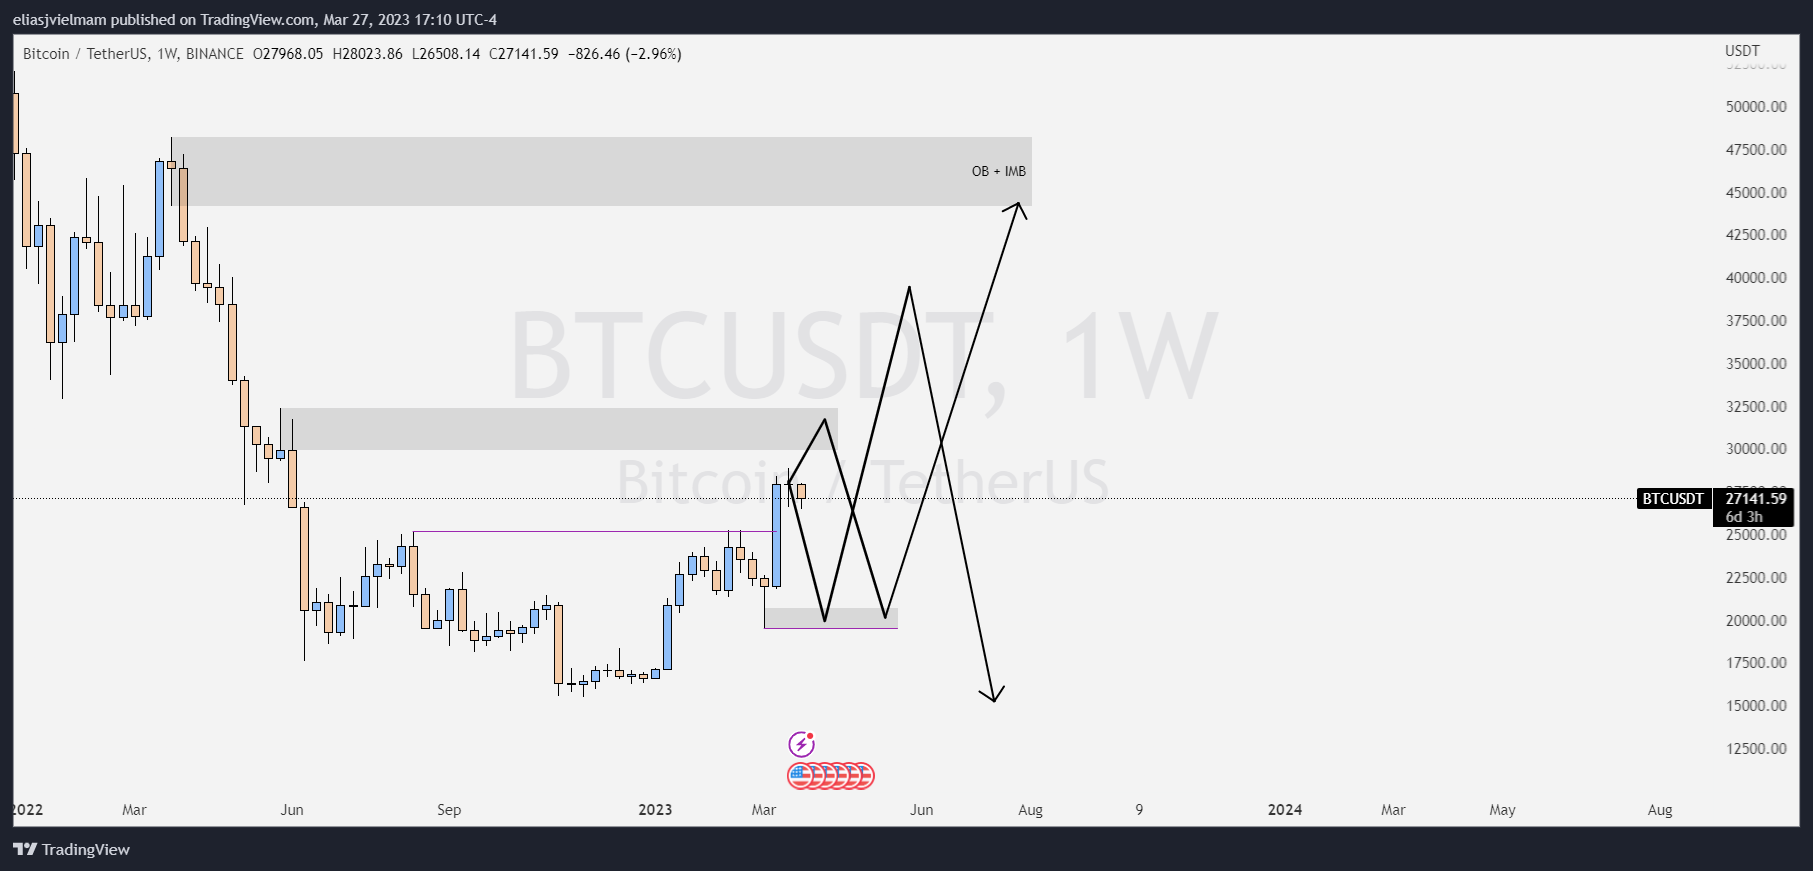
Candles with higher and lower wicks and alike Open and Close prices are named Doji candles. It shows indecision in the markets, and can precede both continuation movements, and retracement moves.
In this case we won't play a predictive game. Instead, we will be vigilant and ready to act (reactive approach) whatever the case may be.
So, now let's go down to Lower Time Frames to identify which zones will be of special importance and ergo crucial for the price to react. Let's go!!
NOTE: We have started the week with a strong fundamental: Binance has been sued by the Commodity Futures Trading Commission or CTFC (source) and this has caused the price to dip a bit.
However, this does not affect the main scenario, as we are focusing on macro-movements (from a Weekly perspective) both scenarios are still valid.
Want to know more about this disturbing new? You can read Binance official reaction here.
The Daily Chart
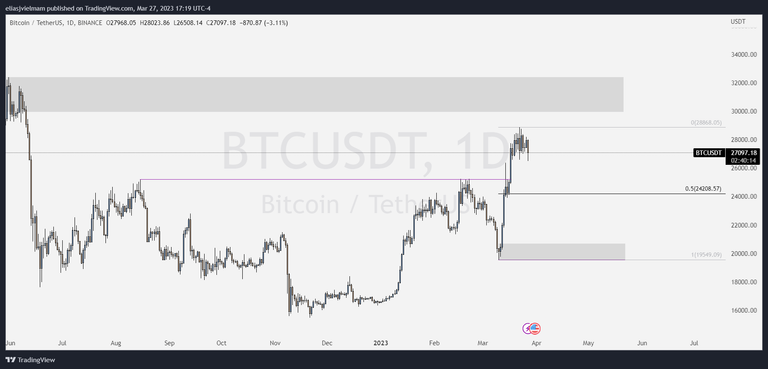
As I already told you, the Week started with a downward movement created by FUD and fundamental news (FUDamentals?) so we will wait and see how this movement will develop.
At the present time we only have three main areas, and another one hidden. Let's study each one.
- The upper zone:
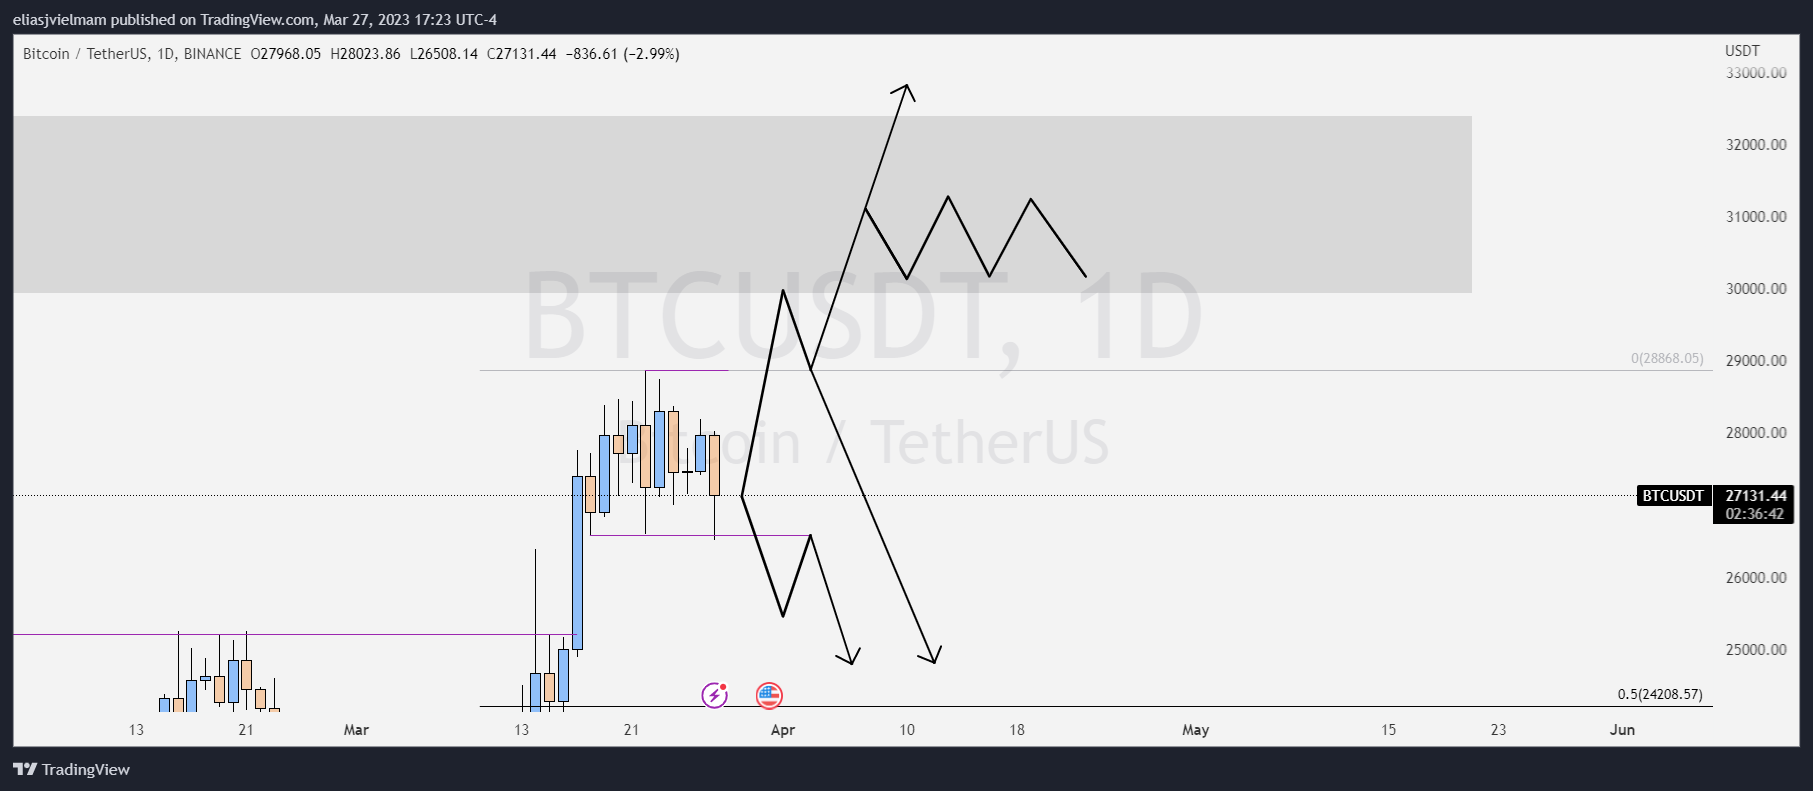
This zone is where the price is trading right now. As you already know, the pump took a lot of people by surprise, as markets were having enough indecision the days before. The upper zone's limits demark a very strong range which we will need to see broken strongly in any direction before confirming a further movement.
We have already seen a very small pierce through the lower range. This is due to the mentioned news, but the price immediately went back to the range. This
small pierce favors a Bullish bias.
Additionally, I have drawn a few possibilities which are more likely to occur. However, we will be reactive, not predictive knowing anything can happen from here, let's just patiently wait and let the price to make its move.
Taking any position here now would be considered high risk.
- The Middle Zone:
Located between $23896.95 and $25211.32, the middle zone would represent a nice retrace to previous impulse, and also has a few confluences that favor a possible reaction, such as:
-- It was the previous resistance zone.
-- It marks the 50% of the impulse.
-- It is an important institutional level. This is confirmed by candlestick patterns.
A few key aspects to take into consideration, in regards to the middle zone:
- A retracement to this area will attract institutional players that will be keen to move the price further, whether it'd be downwards or upwards.
- It is a zone that will provide high liquidity (also known as High Liquidity Zone, Flippy Zone, or simply SWAP Zone) and would be an interesting place for both institutional sellers, and buyers.
- It can provide a better Risk-to-Reward ratio for us to buy, when that time comes, but also could provide us with confirmations to sell, if certain conditions apply.
A key level we'll be very aware of.
- The Lower Zone:
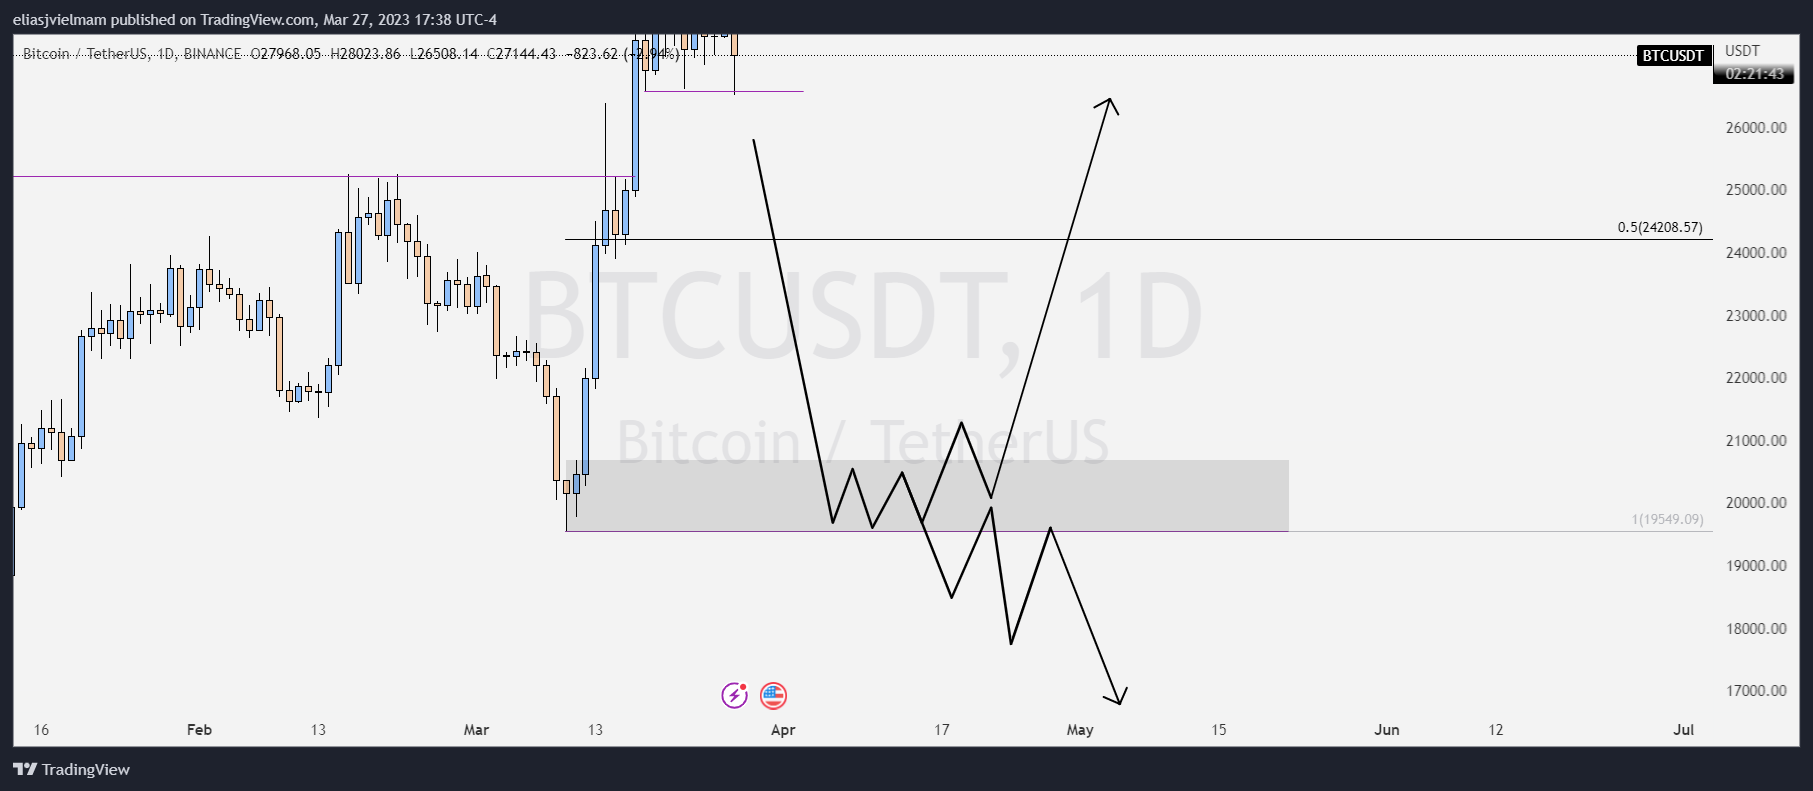
Located between $20681.51 and $$19549.09 it is important to mention that this zone IS NOT THE LOWEST ONE. This zone is the bottom of the last impulsive movement we saw before. As such, it could serve as a new zone for institutions to buy, but if strongly broken, it could also be the last resistance before making a Lower Low movement.
I know nobody wants to see $BTC dip further $16k however, here are a few ideas on why this could be not only possible but also beneficial:
Every cycle has seen a 90% retracement in $BTC's price from its ATH. If this repeats this time also, then we would see a $BTC price of $6900.
If you are aware of the $BTC purpose and design, then you know it is impossible for it go to 0, simply because of its deflationary tokenomics against to the broken inflationary economy the world lives in. So despite 1 BTC always being worth 1 BTC, if you're to measure it in any fiat system, it has only one way to go.
Times have changed: Early in the days, trading $BTC was so easy! You saw a pattern and it had like 90% chance to work flawlessly. "Ascending Triangle! Break - Retest - Buy - TP" it was as simple as that. But now institutions have arrived. This means they will employ the same algorithms they use in tradFi to steal all the people's Stop Losses before making the movement originally intended to happen. In this sense, a break of every support is likely to happen, before the next cycle strongly kicks in and we see new ATH.
- THIS IS NOT FINANCIAL ADVICE -
You already know that, but it is important to state here that I am bullish on blockchain tech, Web3, NFTs, Oracles, AI, IoT, and the Metaverse.
So before deciding committing any money into anything, please always DYOR first.
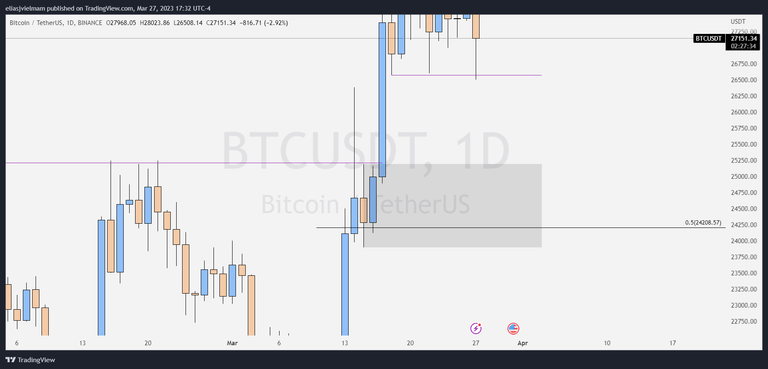
- BONUS ZONE: A Hidden Zone.
We have already saw the three zones corresponding to the last impulsive movement. But I've found out a small zone which could also make the price react and it is hidden between two candles!
Specifically, here:
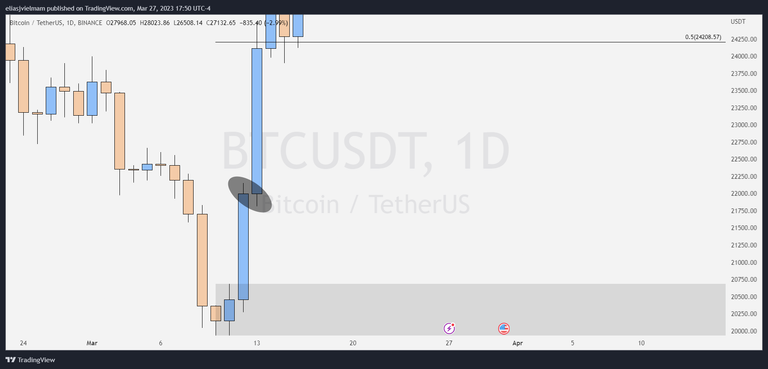
This is a hidden zone which are usually effective! It is located between the Middle and the Lower Zones. Let's check it out in LTF, specifically, in H4 candles:
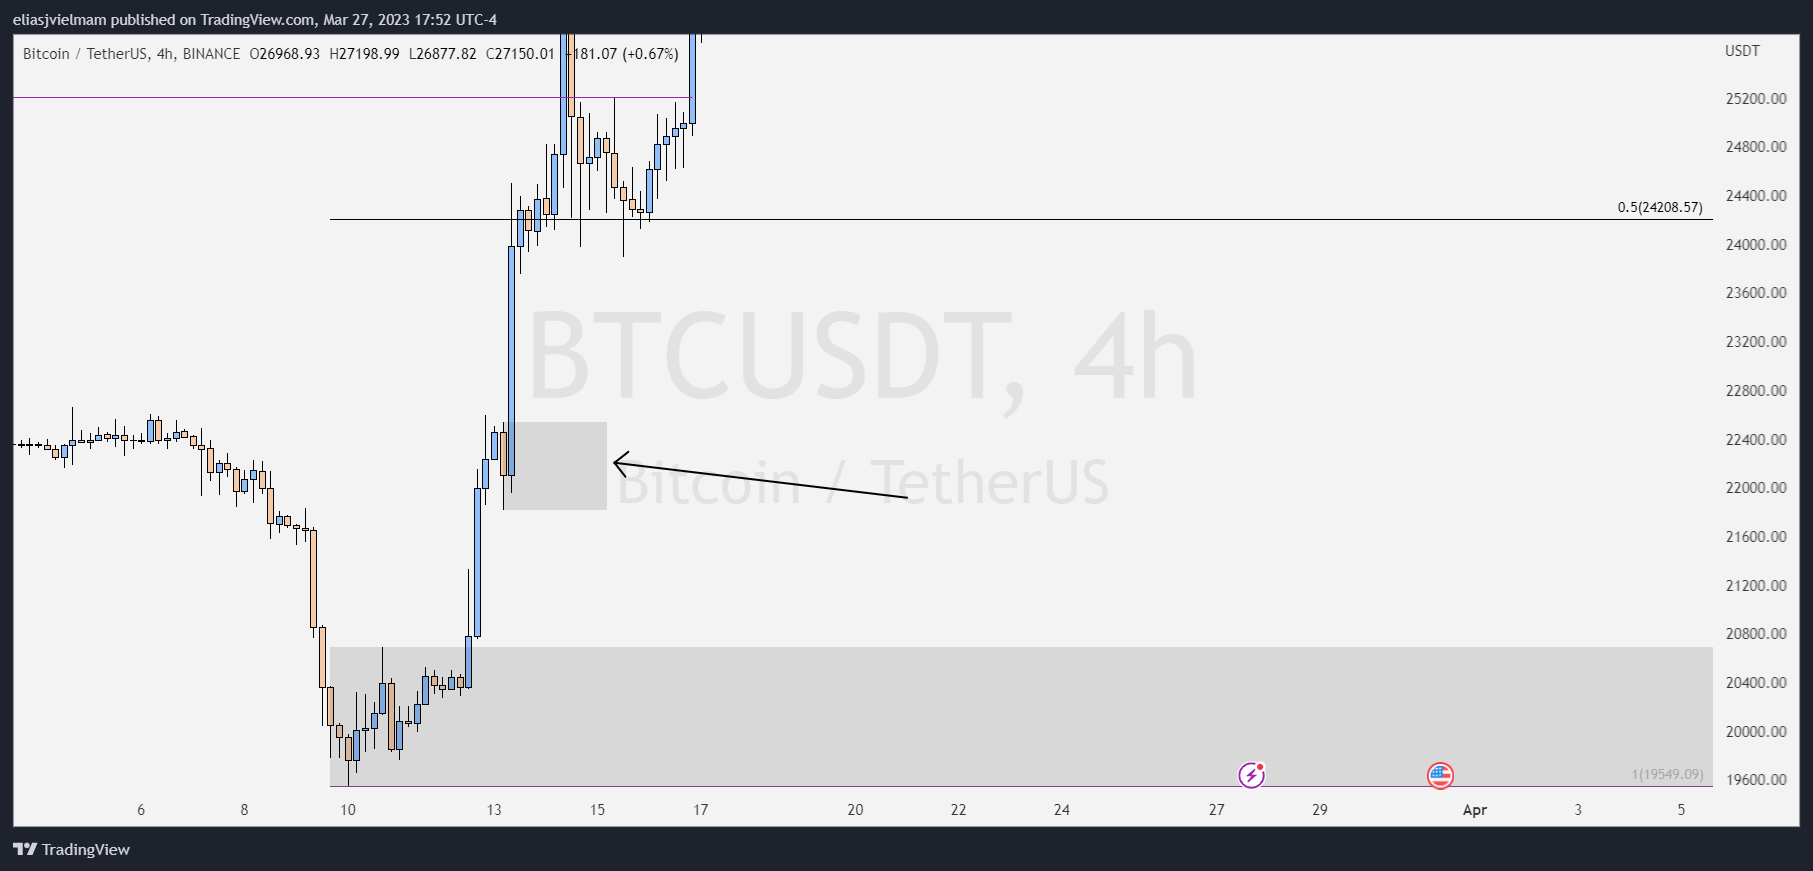
This kind of zones are usually named "Roadblocks". They can cause the price to totally change its direction without reaching the lower zones.
So even though, the lower zones are the ones that hold more liquidity, in order to get there, we will need to see a STRONG breakout of this Hidden Zone. Only then the price will be able to reach the Lower Zone.
If the Price Action indicates us to in accordance to our strategy, we could easily look for a LONG in the Hidden Zone too.
Final Remarks
Did last week was boring?
Undoubtedly no! We need these times of consolidation and ranges so the market can distribute and accumulate enough liquidity to make further movements.
Right now we are seeing a very healthy price, which is ready to gather a bit more liquidity before doing its thang.
This being said, the plan is as follows:
- Wait.
- Wait.
- …and wait.
It is vital for us as traders to know when to rest, when to trade, and when to not do anything. Right now, any position we may take would be more like a gamble, and as such it could make us rich or make us lose our capital.
It is essential for us to take care of our trading capital, so we will wait for the price to reach each one of the zones and develop a price action such as confirmations, breakthrough, or retest and reaction, to then decide position ourselves.
Remember: Patience and focus on the long run.
Stay alive! Trade safe!!

SPANISH:
La calma antes de la tormenta
Un rango esperado...
Tres Zonas, y una Oculta.
Bias Direccional
Hola a todos en las comunidades Hive y LeoFinance!
Este fin de semana decidí disfrutar de un poco tiempo libre y me llevé a la @arkpb a la playa! Tuvimos un día increíble (las fotos de Liketu están pendientes todavia) así que el análisis Semanal, Diario y de bias direccional
de esta semana llegan un poco tarde, pero está bien, porque las ideas principales de trading que tenemos para BTC no cambian.
Hemos visto un rango muy fuerte, como era de esperar. Echémosle un vistazo ahora mismo. ¡¡Vamos!!
El Gráfico Semanal
Como ya les habia comentado (velo aquí) era muy posible tener un rango (osea un movimiento lateral) antes de moverse al alza, o a la baja, ya que ambos movimientos eran (y todavia son) posibles.
Lo que jamas esperábamos era tener un rango tan brutal!
Creo que nunca habia visto una vela Semanal con valores de Apertura y Cierre a solo $4 de distancia uno del otro. Increible.
(La semana abrió en $27972.87 y cerró en $27968.05)
Así que desde una perspectiva Semanal, ahora el escenario nos muestra que podemos tener un movimiento en ambas direcciones:
Si vemos un impulso a la zona OB más alta, entonces estaríamos listos para encontrar una oportunidad de VENTA.
Si lo anterior es cierto PERO vemos perforada esta zona... Uff, en este caso nos vamos mucho mas arriba.
Si vemos un retroceso de nuevo a zonas más bajas, entonces tenemos la oportunidad de usar la estrategia DCA (Dollar-Cost Average) aplicada en zonas específicas, y encontrar oportunidades para abrir un LARGO en Futuros mientras también compramos $BTC en Spot.
Las velas con mechas arriba y abajo pero con precios de apertura y cierre iguales o muy cercanos se denominan velas Doji. Reflejan indecisión en los mercados, y pueden preceder tanto a movimientos de continuación, como a movimientos de retroceso.
En este caso no jugaremos a predecir. En cambio, vamos a estar atentos y listos para actuar (un enfoque reactivo) cuando el precio nos muestre señales claras.
Así que, ahora si. Vamonos a marcos de tiempo inferiores para identificar qué zonas serán de especial importancia y por lo tanto cruciales para el precio ante una posible reaccion. Go!!!
NOTA: Hemos empezado la semana con una fundamental muy fuerte: Binance ha sido demandada por la Commodity Futures Trading Commission o CTFC (fuente) y esto ha hecho que el precio baje un poco.
Sin embargo, esto no afecta al escenario principal, ya que nos estamos centrando en los macro-movimientos (desde una perspectiva Semanal) ambos escenarios siguen siendo válidos.
¿Quieres saber más sobre esta inquietante noticia? Puedes leer la reacción oficial de Binance aquí.
El Gráfico Diario
Como ya les dije, la Semana empezó con un movimiento bajista creado por el FUD y noticias fundamentales (FUDamentales?) así que esperaremos a ver cómo se desarrolla este movimiento.
De momento solo tenemos tres zonas principales, y otra oculta. Estudiemos cada una de ellas.
- La zona superior:
Esta zona es donde el precio está ahora mismo. Como ya saben, la subida fue una sorpresa para muchos ya que los mercados estaban teniendo bastante indecisión los días anteriores. Los límites de la zona superior marcan un rango muy fuerte que tendremos que ver roto fuertemente en cualquier dirección antes de confirmar un movimiento adicional.
Ya hemos visto una pequeña perforación del rango en la parte inferior. Esto se debe a la noticia mencionada de Binance, pero el precio volvió inmediatamente al rango. Este movimiento de pequeña perforación favorece una posibilidad alcista.
Adicionalmente, dibuje algunas posibilidades que tienen mas probabilidad de darse. Sin embargo, seremos reactivos y no predictivos sabiendo que cualquier cosa puede pasar desde este punto del precio (retroceso, rompimiento al alza y retesteo, rompimiento al alza y continuacion).
Vamos mejor a esperar pacientemente y dejemos que el precio haga lo suyo.
Tomar cualquier posición aquí ahora sería considerado de alto riesgo.
- La Zona Media:
Ubicada entre $23896.95 y $25211.32, la zona media representaría un buen retroceso al impulso previo, y además tiene algunas confluencias que favorecen una posible reacción al alza, tales como:
-- Era la zona de resistencia anterior.
-- Marca el 50% del impulso.
-- Es un nivel institucional importante. Lo vemos en unos patrones de velas.
Algunos aspectos clave a tener en cuenta respecto a la zona media son:
- Un retroceso a esta zona atraeria a institucionales que estarian dispuestos a mover el precio aún más, ya sea a la baja o al alza desde esta zona.
- Es una zona que proporciona alta liquidez (también conocida como Zona de Alta Liquidez, Zona Flippy, o simplemente Zona SWAP) y sería un lugar interesante tanto para vendedores institucionales, como para compradores.
- Puede proporcionarnos una mejor proporcion Riesgo-Beneficio como para comprar, pero también podría proporcionarnos algunas confirmaciones para vender, si se dan ciertas condiciones.
Es un nivel clave y muy importante que tendremos muy en cuenta.
- La Zona Inferior:
Ubicada entre $20681.51 y $$19549.09 es importante mencionar que esta zona NO ES LA MAS BAJA. Esta zona solo es la parte inferior del último movimiento impulsivo que vimos anteriormente. Como tal, podría servir como una nueva zona para que las instituciones compren, pero si se rompe con fuerza, también podría ser la última resistencia antes de hacer un movimiento a la baja.
Sé que nadie quiere ver $BTC caer más abajo de los $16k sin embargo, aquí hay algunas ideas de por qué esto podría ser no sólo posible, sino también beneficioso:
Cada ciclo ha visto un retroceso del 90% en el precio de $BTC desde su maximo alcanzado en ese ciclo. Si este patron se repite esta vez también, entonces veríamos un precio de $BTC en los $6900.
Si conoces el propósito y el diseño del proyecto $BTC, entonces sabes que es imposible que llegue a 0, simplemente por su diseño deflacionario, frente a la economía inflacionaria fragil e ilusoria en la que se desarrolla el mundo actualmente. A pesar de que 1 BTC siempre valdrá 1 BTC, si lo mides en cualquier sistema economico actual, sólo tiene un camino y es al alza.
Los tiempos han cambiado: Al principio, tradear con $BTC y cryptos era tan fácil! Veías un patrón y tenía como un 90% de posibilidades de funcionar a la perfección. "¡Triángulo ascendente! Break - Retest - Buy - TP " era tan simple como eso. Pero ahora han llegado las instituciones. Esto significa que emplearán el mismo algoritmo que usan en las finanzas tradicionales (Forex, Commodities, CFDs) para quedarse con todos los Stop Loss de los minoristas antes de hacer el movimiento que originalmente tenian que hacer. En este sentido, es probable que se produzca una ruptura de todos los soportes, antes de que el siguiente ciclo arranque con fuerza y veamos nuevos ATH.
- ESTO NO ES UN CONSEJO FINANCIERO -
Ya tu lo sabes, pero es importante señalar aquí que personalmente yo le voy tremendamente a la tecnología blockchain, Web3, NFTs, Oráculos, AI, IoT, y el Metaverso.
Así que antes de decidir comprometer cualquier capital en cualquier cosa, por favor, siempre DYOR primero (Estudia los proyectos por ti mismo).
- BONUS ZONE: Una Zona Oculta.
Ya hemos visto las tres zonas correspondientes al último movimiento impulsivo. Pero descubrimos una pequeña zona que también podría hacer reaccionar al precio, y está escondida entre dos velas!
Concretamente, aquí:
Esta es una zona oculta. Suelen ser eficaces en aguantar al precio. Se encuentra entre la Zona Media y la Zona Baja. Vamos a comprobarlo en LTF, concretamente, en velas de H4:
Este tipo de zonas suelen denominarse "Roadblocks". Pueden hacer que el precio cambie totalmente su dirección sin llegar a las zonas inferiores.
Por lo tanto, aunque las zonas inferiores son las que tienen más liquidez, para llegar a ellas, necesitaremos ver una ruptura FUERTE de esta Zona Oculta. Sólo entonces el precio podrá alcanzar la Zona Inferior.
Si la Acción del Precio nos lo indica y de acuerdo a nuestra estrategia vemos las condiciones correctas, podríamos fácilmente buscar un LARGO en la Zona Oculta.
Comentarios Finales
La semana pasada fue aburrida?
Nel! Necesitamos estos tiempos de consolidación y rangos para que el mercado pueda distribuir y acumular suficiente liquidez para realizar nuevos movimientos.
Ahora mismo estamos viendo una accion de precio muy muy sano, que está listo y preparandose para acumular un poco más de liquidez antes de hacer de las suyas.
Dicho esto, el plan es el siguiente:
- Esperar.
- Esperar.
- ...y esperar.
Es vital para nosotros como traders saber cuándo descansar, cuándo operar y cuándo no hacer nada. Ahora mismo, cualquier posición que tomemos sería más bien como una apuesta, que podría hacernos ricos o hacernos perder nuestro capital.
Es esencial que cuidemos nuestro capital de trading, por lo que esperaremos a que el precio alcance cada una de las zonas y desarrolle una acción de precio como confirmaciones, ruptura, o retest y reacción, para luego decidir posicionarnos.
Recuerda: Ten mucha paciencia y concéntrate en el juego a largo plazo.
Manten vivo tu capital! Tradea a lo seguro!
Traducción realizada con la versión gratuita del traductor www.DeepL.com/Translator
Posted Using LeoFinance Beta
Congratulations @elyelma! You have completed the following achievement on the Hive blockchain And have been rewarded with New badge(s)
Your next target is to reach 150 posts.
You can view your badges on your board and compare yourself to others in the Ranking
If you no longer want to receive notifications, reply to this comment with the word
STOPTo support your work, I also upvoted your post!
Check out our last posts:
https://twitter.com/1366686073250865153/status/1640480685256241156
The rewards earned on this comment will go directly to the people( @elyelma ) sharing the post on Twitter as long as they are registered with @poshtoken. Sign up at https://hiveposh.com.